The connected corridor
To assist the Texas Department of Transportation (TxDOT) in meeting the challenges of a $2 billion reconstruction of I-35 in central Texas, Texas A&M Transportation Institute (TTI) has designed, deployed and implemented an advanced construction traveler information system to keep the public informed, enhance safety and facilitate mobility during the 8-year construction horizon that spans 13 different projects awarded to multiple contractors.
The 96-mile I-35 corridor carries more than 100,000 vehicles per day, with two-thirds of those traveling to final destinations outside the corridor to the north or south. That’s more than 30 million vehicle trips per year and a total of more than 250 million vehicle trips over the eight years of construction (2010-2018). When complete, this section of I-35 between Hillsboro and Salado will be expanded from four lanes to six in rural areas and to eight lanes in urban areas, with continuous one-way frontage roads.
The most significant challenges that TxDOT faces, along with issues such as phasing and access, are minimizing the construction impacts to travelers and businesses/landowners along the corridor, and providing real-time traffic information to those groups and to freight operators, so they can make informed travel choices.
Enhancing mobility, safety
The traveler information system has several advanced field components that enhance the mobility and safety of the corridor. Portable changeable message signs provide up-to-date travel time information to the nearest major destination on the corridor. In addition, dynamic queue warning systems deployed at the construction-related freeway lane closures alert drivers where and when slow or stopped traffic might be ahead.
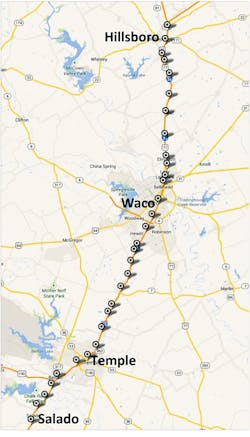
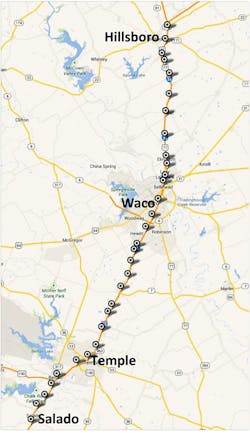
Figure 1. Bluetooth readers along I-35
As the operating agency, TxDOT greatly benefits from feedback on the performance of these systems during the observed impacts of construction and incidents. To provide this feedback, the project team prepares post-event evaluations of major construction activities, such as significant lane closures, and of incidents and planned special events along the corridor. The results are examined to see where improvements can be made, if recorded conditions differed greatly from projections (and why), to provide data for monitoring the overall performance of the systems, and to determine the impact the activities had on travelers.
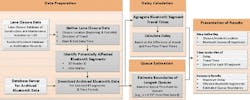
Figure 2. Steps of post-event impacts analysis
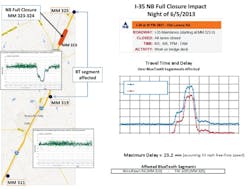
Figure 3. Impact of freeway closure on I-35
Bluetooth benefits
The primary purpose of deploying Bluetooth technology on the I-35 corridor expansion project was to provide drivers with real-time travel times and delay information during construction activities along the corridor. However, additional benefits have come from interrogation of the historical data.
Across the corridor, Bluetooth readers are deployed at an average of a 4-mile spacing with a minimum distance of 0.9 miles and maximum distance of 11.5 miles between consecutive readers, as shown in Figure 1. An evaluation tool assesses the impacts of major construction activities and incidents that occur on the corridor. The tool continues to be refined and updated. Impacts are presented in terms of delays and queue lengths as determined from post-processing the historical Bluetooth data.
The travel time of each individual vehicle observed by the Bluetooth detectors can only be determined after it passes the entire roadway segment between two consecutive Bluetooth readers. Therefore, there is a lag between the time a vehicle enters the segment and the time its travel time is recorded. The lag depends on both the distance between detectors and the actual traffic conditions on the roadway segment. Since the lag is dynamically changing, its use for real-time prediction of travel times and delays can be quite challenging. However, it can be effectively used for post-event analysis of travel times and delays. The tool combines custom programming with a spreadsheet-based user interface. Figure 2 summarizes the major steps of performing an impact analysis of work-zone lane closures or incidents. Application of the tool is illustrated by the following two case studies: (1) a freeway work zone with the closure of all main lanes and (2) a major incident on I-35.
Freeway work-zone case study: The first case study is a nighttime work zone involving bridge work that required the closure of all I-35 main lanes in the northbound direction. The freeway was closed at 7 p.m. on June 5, 2013 and reopened at 7 a.m. During the closure, I-35 traffic was diverted to the frontage road. The results of the closure analysis are shown in Figure 3.
The bold orange line on the map shows the segment of freeway that was closed in the northbound direction between mile markers (MM) 323 and 324. The locations of the Bluetooth readers used in the analysis are marked by three blue dots. The two scatter plots over the map show the average speed of individual vehicles over time as they traveled through the Bluetooth segments. The considerable drop in vehicle speeds between the Bluetooth readers at MM 319 and 325 indicates that there was significant congestion in this segment. The fairly constant speed profile on the second scatter plot indicates that vehicles were traveling at free-flow speed in the Bluetooth segment between MM 311 and 319, so traffic was not affected by the construction upstream of MM 319.
The line graph to the right of the map shows how travel times (blue line) and delays (red line) changed over time. The maximum delay caused by the freeway closure was about 23 minutes, occurring at approximately 10 p.m. There was some queuing between 6:30 p.m. and midnight, with the maximum queue length less or equal to 4 miles (i.e., the queue never extended beyond the first Bluetooth reader upstream of the freeway closure). The spacing of the Bluetooth segments did not allow more refined queue-length estimates at this location. There was no delay after midnight.
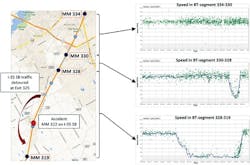
Incident case study: The second case study is a severe crash involving an 18-wheeler that caught on fire. The incident occurred near MM 322 in the southbound direction of I-35 on Aug. 13, 2013. A full closure of the southbound direction was necessary, and I-35 traffic was diverted to the frontage road at Exit 325, as shown in Figure 4.
Figure 4. Accident on I-35 southbound on Aug. 13, 2015
Data from three Bluetooth segments were analyzed. The speed time series for each segment is shown in the scatterplots to the right of the map. The significant and long-lasting speed drop between MM 319 and 328 is evidence of sustained congestion with very slow moving vehicle queues in that freeway segment upstream of the accident location. The speed drop between MM 328 and 330 was also significant but started later and lasted for a shorter time. The results indicate that the slow-moving vehicle queues extended even into this segment of the freeway, more than six miles upstream of the accident location. Upstream of MM 330, traffic conditions were not affected by the incident.
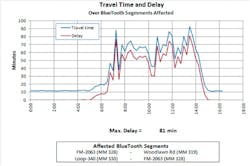
The early morning accident caused significant delay from 6:30 a.m. through 3 p.m. The maximum delay was 81 minutes. There also were some significant queues with a maximum queue length somewhere between 6 to 8 miles. The longest queue was observed at 2 p.m.
Estimating queue lengths
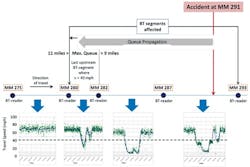
As illustrated by the two case studies, travel times and delays can be accurately determined, but queue lengths can only be estimated using Bluetooth data. If more refined queue-length estimation is required, then the use of more closely spaced Bluetooth device pairs (Bluetooth segments) is one option, although other technologies also can provide the appropriate data. The advantage of using a sequence of shorter Bluetooth sections instead of a single long section is that the approximate location and extent of vehicle queues can be estimated by identifying the last upstream Bluetooth segment where speed is still below a pre-defined queue threshold (e.g.,< 40 mph in case of freeways).
This approach gives an interval estimate for the maximum queue length. It can only tell that the longest queue extended to a point somewhere between two consecutive Bluetooth devices. The shorter the Bluetooth segment, the more accurate the queue length estimation is. This method of queue-length estimation is illustrated in Figure 5—assuming a hypothetical incident at mile marker 291, and using a sequence of four Bluetooth segments that completely covers the roadway segment affected by the impact of the incident.
Analyzing Bluetooth data on I-35
In addition to evaluating the impacts of single construction projects or incidents, the method also has been used to determine the combined impact of all concurrent construction projects and incidents for specified segments and for the entire corridor of I-35 between Salado and Hillsboro, Texas. For example, a daily analysis of the past 24-hour period is routinely performed to determine travel times and delays in 15-minute intervals between the major population centers of Hillsboro, Waco, Temple and Salado.
The Bluetooth-based postmortem analyses of freeway work zones and incidents on the I-35 project have been used for:
• Assessing the actual impacts of construction-related lane closures and incidents that occurred in the corridor, separately and in combination;
• Identifying major bottleneck locations and the time periods with the most severe negative impacts (i.e., longest delays and queues);
• Determining mobility-related work-zone performance measures at project- and corridor-level;
• Verifying the suitability of deployed queue warning system designs and providing feedback to help decisions on future deployments; and
• Providing calibration/validation data for delay and queue estimation models.
Figure 5. Estimation of maximum queue length
The results of post-event analyses of work-zone lane closures provide continuous feedback to TxDOT and TTI regarding the operational and safety performance of various field components of the traveler information system (e.g., en-route travel time messages and dynamic queue warning system). They also help in calibrating key model parameters used by delay and queue estimation models to predict the expected impacts of future work zones. Design decisions based on such improved delay and queue prediction models are expected to result in safer and more cost-effective queue warning system deployments. TM&E
