Getting the story right
Non-recurring events, such as incidents, work zones and severe weather, have significant impacts on transportation systems. Agencies increasingly are applying operations strategies to lessen these impacts. And it is growing more and more critical that transportation agencies measure the results of such strategies.
The essence of such performance measurement is to study and learn from successes and failures, so as to repeat the former and avoid or mitigate the latter. For this reason, several agencies conduct debriefs of non-recurring events on a limited basis. The Virginia Department of Transportation (VDOT) decided to take this approach one step further and standardize such post-event analyses. VDOT recently completed a prototype study to learn lessons from its system operations during non-recurring events.
VDOT recognized twin challenges in the uniqueness of non-recurring events and the traditional lack of data to analyze them in detail. However, VDOT also realized the new opportunity provided by third-party travel-time data. Bringing all these aspects together in 2013, VDOT executive management directed a research project to analyze in detail a number of incidents, work zones and weather events, each with different characteristics such as diversity in geographic location, sub-type of event, isolation from other events and scale of impact. The research team was comprised of the Virginia Center for Transportation Innovation and Research (VCTIR) and the University of Virginia Smart Travel Laboratory.
The focus
We saw three main questions that needed to be answered for a successful learning experience:
1. What happened? What were the spatial and temporal dimensions of the impacts to the travelers? How intense were the impacts?
2. What actions did the agency take? When? And where? and
3. What could the agency do differently in the future, to eliminate or mitigate such impacts?
In answering these questions, we essentially reconstruct the events, and the management often unearth insights and more detailed questions. The insights helped to improve communication with the elected leaders and citizens, and to identify resource needs. The detailed questions may sometimes be hard to answer, owing to data limitations, or because they point at existing agency inefficiencies. However, asking and answering them are crucial to a forward-thinking, continually learning organization.
The findings
The study approach and results presented here are derived mainly using three specific examples: a truck rollover that spilled 1,000 gal of asphalt and closed an interstate segment for about seven hours on a busy Thursday afternoon, and two work zones—one where a contractor went beyond his/her allowable work-hour window during a Monday morning rush hour, and a second where several different work zones were active in a concurrent space and time.
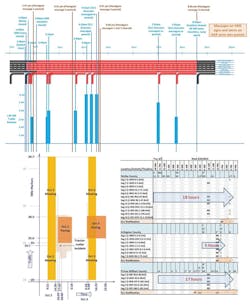
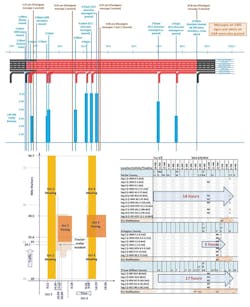
A timeline of events and actions is a powerful visualization to illustrate agency activities in response to an event. VDOT stores all event information and actions in databases. Figure 1 presents the information for the asphalt incident (top), a work zone (bottom left), and a weather event (bottom right). The incident timeline displays the same road cross-section (here it includes a ramp, shown for select times) across time on the X-axis. Red color indicates a closed lane or shoulder, while black indicates open status. The event details and agency actions are called out above the timeline; the queues observed in the field are graphed below. Based on these visualizations, managers asked if any messages could have been posted earlier. Could the detours have been set up sooner? Which begged the further question, should we focus on collecting queue information more frequently?
Clearly, for event timeline visualization, one size does not fit all situations. Work zones and weather events are often spread across a wider space and time than incidents, demanding a two-dimensional space-time presentation. Furthermore, weather conditions and intensity also change across space and time. Jurisdictional boundaries also may reveal differences in the resources available.
Figure 1. Event timelines for the asphalt incident (top); a set of concurrent work zones (bottom left); and a weather event (bottom right).
The work-zone graph in Figure 1 shows delays beyond the work-zone extents, as well as an incident that occurred. In the weather event timeline, each letter represents a specific weather or road condition observed for that location and time period. The bold arrows represent the entire event and impact duration, from the first sighting of snow to the full clearing of all roads, for each jurisdiction.
The questions of event impacts and their intensity were answered through a number of visualizations and tabulated performance measures. Speed plots (Figure 2) provide quick views of the intensities of delay across space and time. The dark boxes show the scheduled work-zone extents. Mowing equipment locations are currently not tracked to know exactly where they were present at a specific time. Some work-zone start/end times and locations could also be different from the planned schedule.
Figure 2. Speed plot highlighting concurrent work zones and speed data of interest (source: VPP Suite).
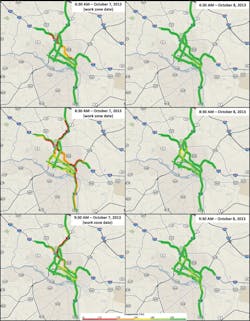
Another type of visualization, a trend map (Figure 3), is an animated movie that shows the same delay impacts across the whole network over time. Three specific 10-minute frames are presented in Figure 3, demonstrating the impacts on the route with the work zone and the detour routes, over time. Both these visualizations came from the Regional Integrated Transportation Information System (RITIS) Vehicle Probe Project (VPP) Suite, developed and maintained by the University of Maryland Center for Advanced Transportation Technology (UMD CATT) Lab.
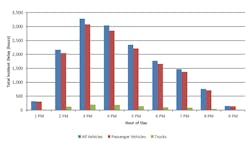
Detailed graphs (Figure 4) helped break down the impacts by hour. Tabulating the measures, as shown in Table 1, allowed for quantitative comparison of events and their impacts. All these visualizations generated several questions and discussions, including:
• For the work zone illustrated in Figure 2, which data do we place more confidence in—work zones, speeds, both, or neither?
• Should we try a different detour in future, for a similar situation, as in Figure 3? and
• Given these hourly impacts for the asphalt incident (Figure 4), could we have followed a different incident clearance approach that might have cost more money upfront to the agency, but caused less overall burden to the citizens?
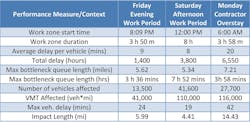
Table 1 shows different measures that help an agency with different decisions: While the total user delays and costs signify the economic impacts of an event to the motorists, queue lengths tell an agency where to post back-of-queue warnings; queue durations help to plan other adjacent work zones; and showing the impacts of different work zones side by side helps elected leaders and citizens clearly understand the tradeoffs involved in road or lane closures for different times of the day and days of the week.
Based on the event duration and maximum bottleneck queue duration demonstrated in Table 1, the Friday and Monday work zones seem similar. Based on VMT affected, Saturday and Monday events seem similar. Yet, while many more vehicles were affected on Saturday, much more total delay was encountered on Monday. Therefore, we recommended considering a set of diverse measures for a balanced event assessment.
Figure 3. Trend map showing congestion across space and time,
with and without work zone (Source: VPP Suite).
In this study, we did not directly answer the question of what could be done differently, because a number of interrelated factors guide the decision-making processes. These factors include existing policies, weather conditions and availability of resources, including funds, staff, equipment, supplies and information, as well as the event context.
Further, several operations components contribute to the observed outcomes. For example, traffic cameras, information dissemination, detour planning and implementation, coordination with other responders and jurisdictions all play a crucial role in efficient clearing of incidents. We were unable to assess the individual role of each factor, component and decision on the final outcomes. However, the tables and visualizations presented earlier added tremendous value by generating and supporting detailed discussions among the managers and the field staff, who addressed and assessed all these aspects together.
Approach lessons
We also learned some important lessons on how to arrange and perform these analyses better in future. First, user delay and cost calculations during high-impact non-recurring events must be different than those for recurring events. In the latter case, average traffic volumes are often reasonable to assume. However, full or partial road closures and emergency declarations during high-impact events significantly alter the traffic volumes. In these cases, we found that queue information gathered by field staff (as in Figure 1) is a better indicator of user delays and costs.
Second, data quality assessments are essential foundations for answering all the questions. Data quality problems will undermine the operations story. We recommended a cautious interpretation of suspect data.
Third, additional user delays or costs due to non-recurring events are often requested by managers. To calculate these measures, “normal” delays and costs should first be defined. Such normal values are termed as benchmarks. For some events, we found more than one reasonable set of benchmark days. For weather events, when the traffic demand is much lower than nearby work days, delays also were much lower, resulting in negative additional delays which were not meaningful. We recommended a careful analysis of the available benchmarks for each measure and event.
Table 1. Work-zone performance measures:
In closing
A learning organization has to ask itself focused and potentially difficult questions, repeatedly and frequently, and not just on special occasions. Therefore, automation of measure calculations and visualizations is essential. Even where customization is necessary, automation can offer multiple choices, so analysts and managers can select the visualization they prefer for each specific event.
Figure 4. Hourly distribution of vehicle delays for the asphalt incident.
We believe strongly that this is quite possible and immediately needed. If analysts must manually pour through the data sources, the laborious process increases costs and takes more time, more than most agencies can afford. On the other hand, the more agencies conduct detailed event analyses, the more they will be able to find patterns in the data and improve their operations strategies. Performance measurement is inherently insightful, and agencies would benefit immediately from implementing even a handful of performance measures. TM&E
Acknowledgements
The authors are grateful to the following people for providing feedback and data access: Robert Borter, Paul Bridge, Ken Earnest, Dean Gustafson, Rose Lawhorne, Mark Mandell, Cathy McGhee, Ann Overton, Oliver Rose, Stacy Sager, Nicole Schwarz, Earl Sharp, Paul Szatkowski, Joe Wilde and John Yorks.
