Looking for dirt
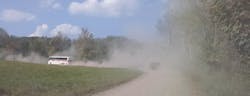
Central Pennsylvania may not be the first place that comes to mind when you think about dusty roads, but even in the heavily forested Northeast, road dust is an issue. Whether a landowner nuisance, driver hazard or human health concern, dust from unsealed roads is a headache for the road owner.
Pennsylvania presents a unique environment for road dust impacts on aquatic habitats, as topographic constraints on road locations place a high density of roads near streams. The dense overhead canopy and understory cause dust loading on vegetation, which can lead to the degradation of water quality as the first flush of a rainstorm quickly transfers dust from areas of deposition to nearby streams. Additionally, the close proximity of roads to streams in Pennsylvania plays an important role in direct runoff of fine road dust material from the road surface during storm events.
Armed with this knowledge, the Center for Dirt and Gravel Road Studies (CDGRS) at Penn State identified the need to quantify fugitive dust from Pennsylvania’s unpaved roads. This investigation set out to monitor dust emission levels from unsealed road surfaces composed of the CDGRS-developed Driving Surface Aggregate (DSA) specification, and another commonly used surface aggregate, Pennsylvania Department of Transportation 2A specification (PennDOT 2A). PennDOT 2A was originally developed for use as a porous base under asphalt, while DSA was specifically developed for use as a wearing course on unpaved roads and has been used extensively in Pennsylvania since 2000.
What is Driving Surface Aggregate?
DSA has a unique particle size distribution designed to achieve maximum compaction density and produce a durable road surface that performs better and requires less maintenance than conventional aggregates. For a quarry to be able to market aggregate as DSA it must meet the Pennsylvania State Conservation Commission (SCC) Driving Surface Aggregate Standard and Specification. This specification includes controls on clay by imposing a maximum Plasticity Index of 6 and requiring the use of rock fines if material needs to be added to the aggregate to meet the #200 (75 µm) sieve gradation requirement. Additionally, DSA is typically placed with a track-mounted paver at optimal moisture content and roller compacted to maximum compaction density as defined by a standard proctor test. PennDOT 2A, on the other hand, requires fewer specifications to be met, and there are no controls on clay fines. Both the DSA and 2A road surface material in this study were produced from local limestone quarries.
Previous investigations of DSA performance by CDGRS have shown up to a 90% reduction in sediment runoff from DSA compared to other aggregate road surfaces, and it is presumed that the limited amount of fine material present on the road surface would translate into dust reductions. Qualitative observations of DSA roads have indicated reductions in dust generation and dispersal compared to other unpaved road surfaces. To quantify relative dust production from DSA and 2A road surfaces, a test site was selected in Rothrock State Forest in central Pennsylvania near State College, Pa. The Laurel Run Road study area is 5.7 km long, and is surfaced with three sections of DSA and one section of 2A. In order of travel direction, the test sections are DSA 1 placed in 2012, DSA 2 placed in 2015, PennDOT 2A placed in 2015 and DSA 3 placed in 2015. Each of the first three sections is approximately 1 km in length and the final section (DSA 3) is approximately 2.7 km long.
Dust monitoring
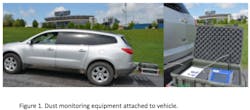
To carry out the study, CDGRS developed a low-cost dust monitoring method to quantify relative differences in dust generation from the road surfaces. Dust monitoring was conducted in real time using a vehicle-mounted particulate monitoring system that incorporated TSI DustTrak 8530 monitors and a GPS unit to spatially locate the monitoring points (Figure 1). Sampling of both PM10 and PM2.5 dust fractions took place behind the vehicle at approximately 1 meter above the road surface to measure the dust concentration within the wake of the vehicle. The vehicle maintained an average speed of 25 miles per hour to control a variable known to increase dust generation. In addition, variables that influence dust production in forested environments such as road surface temperature and canopy cover were explored.
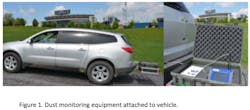
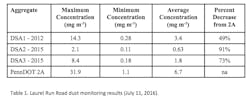
In order to visually represent the large amount of data generated from multiple days of testing, “heat” maps of dust production were created by combining the dust monitoring data points and GPS tracklog points (Figure 2). The data shown were collected at two-second intervals. After visually exploring the dust trends between each aggregate type, the different DSA sections were compared to the 2A section. The July 11, 2016, test data show that DSA outperformed the 2A in suppressing dust (Table 1). The 2A section had an average PM10 dust concentration of 6.7 mg m-3 and a maximum point concentration of 31.9 mg m-3 compared to an average PM10 dust concentration of 1.9 mg m-3 and a maximum point concentration of 14.3 mg m-3 across all DSA sections. To verify the trends, statistical analysis was performed between the different age DSA and 2A sections to determine if dust production was significantly different between aggregate surface materials. The analysis showed that all three DSA road sections significantly outperformed the 2A road section in suppressing vehicle-generated dust. Notably, the DSA 1 that was placed in 2012, which would not meet the current CDGRS specification due to high plasticity, still produced significantly less dust than the 2A section.
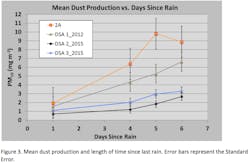
To explore the effect of road drying on dust production, dust monitoring also was conducted on multiple days after a rainstorm. Figure 3 shows the time series of dust production (PM10) for the different road sections. When the averages of dust concentrations for each aggregate section were compared for days 1, 4, 5 and 6 after the rainstorm, trends emerged. As the road dried out, the effect of this drying was evident in the large increase in dust for all surfaces between day 1 and day 6 after the rain. The different ages of DSA all outperformed the 2A aggregate in suppressing dust for all days after the rain. Additionally, the two DSA placements from 2015 that meet the current specification outperformed the 2012 DSA placement that does not meet the current specification.
All of the dust monitoring data collected to date show that the DSA developed by CDGRS outperformed commonly used PennDOT 2A aggregate in suppressing vehicle-generated dust. The DSA road surfaces produced 50% to 90% less dust than the 2A surface, and the newer DSA sections that meet the current CDGRS specification performed the best at reducing dust. These results strongly indicate the benefits of using a high-quality road surface aggregate with tight specifications such as DSA to reduce dust production from unsealed roads. A high-quality aggregate placed at optimum moisture content and properly compacted can make a high-quality driving surface and reduce dust generation, resulting in an enhanced user experience compared to traditional aggregate placements.
Influence of canopy and future work
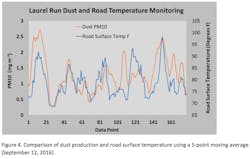
During the study it was noted that canopy cover shading the road provided additional dust suppression. To explore the effect of canopy cover on dust production, initial testing of a real-time infrared road temperature sensor was conducted. Road surface temperature variations of over 25° between shaded and open areas are common. Higher dust values were correlated with higher temperatures, and the response can be attributed to canopy cover and the amount of shading on the road surface (Figure 4). Although the role of canopy cover on dust production has not been fully explored, initial results indicate that using a high-quality aggregate such as DSA in combination with canopy cover provides significant reductions in vehicle-generated dust from unpaved roads.
Future research into the correlation between canopy cover, road surface temperature and dust production is being conducted in a collaboration with the College of Agricultural Sciences at Penn State. Initial data collection of high-quality canopy maps above forest roads began in 2018 using unmanned autonomous system (UAS) based LiDAR and photogrammetry. Data derived from this collaboration will include the percentage of canopy cover above the road surface, canopy height above ground surface, and canopy structure and density. This information will be combined with road surface temperature and dust monitoring to create a data set that can be used to predict dust loads and guide management of road corridor canopy and surface aggregate choices to help reduce vehicle-generated dust.
The author would like to thank the Pennsylvania Department of Conservation and Natural Resources (DCNR) and the Pennsylvania SCC for funding this study. More information on Driving Surface Aggregate and dust monitoring is available at www.dirtandgravel.psu.edu.