Leveraging probe vehicle data to analyze evacuation route resiliency
Probe vehicle speed data has become an important data source for evaluating the congestion performance of highways and arterial roads. Predefined spatially located roadway segments known as traffic message channels (TMCs) are linked to commercially available, temporal anonymous probe vehicle speed data. The availability of speed data for a specific segment or time is based on the presence of a telemetrically tracked vehicle being observed over the length of a predefined roadway segment during a specific time period. In New Jersey alone there are over 16,000 TMCs distributed across the state. Because these data sets cover a large region, they have been used to develop agency-wide performance measures to better plan and manage infrastructure assets. They can also be used to quantify the regional impact of a major weather event on a surface transportation network. To demonstrate a regional application of these data sets, an analysis of vehicle speed data during Hurricane Sandy—which at the time was the second costliest hurricane in the U.S.—was used to evaluate the regional impact of the storm. A subsequent analysis was conducted to demonstrate how the same probe data could be used to evaluate the day-to-day congestion along the coast for an entire year.
Methodology
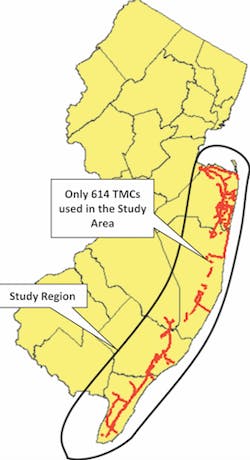
The mechanism for processing probe vehicle speed data requires a cross-reference between spatially defined TMCs and time-stamped temporal speed data sets. The speed data are commercially available throughout the U.S. and a number of other countries. Where data are available, the speeds over a variable length TMC can be collected in one-minute increments. A congestion performance metric in the form of regional travel time increase (RTI) was developed as part of the study to quantify the overall variation in travel time across a region. A layout of the study area, which includes highways, arterials, and local roads, is shown in Figure 1. Only those TMCs located within 10 miles of the New Jersey coast were evaluated.
The speed data can tell a story on how well the infrastructure is performing. There are many ways to analyze the speed data, but a simple approach is to evaluate how the congestion performance metric, RTI, changed during the storm as compared to previous years. Additionally, the absence of data provides insights into how many vehicles might be traversing a TMC or if a TMC is traversable. Both of these analyses were conducted for the study site.

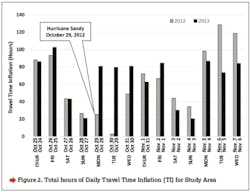
Measure of RTI: The RTI provides a means for a macro-characterization of the relative regional congestion intensity. A 14-day analysis of the daily RTI spanning the landfall of Sandy (Figure 2) shows that the RTI is lower on the day-before, day-of, and day-after event, when compared to the traffic on the same dates/day of week the following year (2013). There was a mandatory evacuation put into place on Oct. 28, 2012. When the evacuation occurred the typical RTI expected on a Monday did not occur, which may be indicative of one of the following three possibilities:
1. People did not leave and stayed off the road.
2. People evacuated, left early, or did not return to the coast after the evacuation order was put into place.
3. The roadway infrastructure was damaged or blocked which would not allow vehicles to cross TMC segments.
Four days after the hurricane (on Nov. 3, 2012) there was an increase in RTI indicating that motorists and/or construction crews were heading back to the coast to clean up after the storm. Another reason there could have been an increase in RTI is that there was a decrease in the infrastructure’s ability to handle capacity. To get an idea of the roadway resiliency throughout the storm, an analysis of the data availability was conducted.
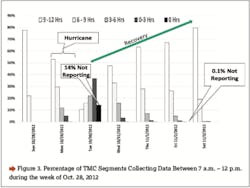
Measure of Data Availability: Even during a snowstorm where travel times increase due to the weather, a TMC will still continue to report data. However, in an evacuation-type condition people are not expected (or potentially allowed) to be on the road, and TMC data will stop reporting. But when drivers are once again allowed to return to the roadways, TMCs are expected to report data on all of the roadways unless the roadway is impassable. This is one way an evaluation of a regional roadway system’s resiliency can be conducted after a major weather event. To quantify data availability, a binary indicator of data presence was assigned during a 12-hour period (0700-1900) broken into 15-minute increments. All 614 segments in the study area (Figure 1) were analyzed from Oct. 28 to Nov. 3, 2012, to track data availability. The graphical representation of the daily regional TMC data availability is shown in Figure 3. The day following the hurricane had a number of TMCs (86 out of 614) not reporting data. Although there is still one TMC with no data being collected on Friday 11/2/2012, most of the TMCs are observed to be collecting some data indicating that vehicles are traversing the segments, and the system has recovered to the point so vehicles can pass. It was verified that the single TMC not reporting data was made impassable from the storm. The figure also illustrates that 80% of TMCs were reporting data after the storm on Saturday (11/3/2012). This is about the same percent of TMCs reporting on the Sunday (10/28/2012) before the storm when the mandatory evacuation was put into place. The presence of data before and after the storm is indicative of full recovery. Thus, Figure 3 quantifies the resiliency of the analyzed system as it recovers from the effects of Hurricane Sandy.
By analyzing both the congestion and the data availability of the system, a better understanding of the recovery of the system can be understood. The decrease in RTI congestion (Figure 2) corresponded with the decrease in available data (Figure 3). This shows that the evacuation was successful in the sense that vehicles were not on the road, although people may still not have evacuated and instead chose to stay in their homes.
Ongoing Evaluations
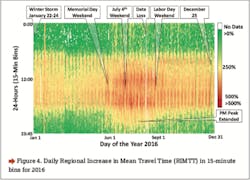
Although the locations of increased RTI could be qualitatively observed (Figure 2) it would be difficult to represent this data over an entire year in a single snapshot. A new performance metric was developed called the Regional Increase in Mean Travel Time (RIMTT). For this performance measure all the RTI values are aggregated for every TMC in several discrete 15-minute bins. A representation of this performance measure for 2016 is shown in Figure 4, where several events occurring in the region are identifiable from the data visualization. From the figure, the winter storm in January is identified as well as the summer holidays: Memorial Day, Fourth of July, and Labor Day weekend. All these holidays are expected to routinely increase congestion because the coastal region is a major destination in New Jersey during the summer. Other notable observations from this figure include an increase in congestion during the evening hours, data loss on August 15, and a noticeable drop in congestion on Dec. 25. This method can be used to observe the region and characterize the congestion throughout the year. Further research is necessary to compare multiple regions and year-to-year congestion.
Closing
With the availability of statewide vehicle probe data, the pulse of the traffic network can be documented and compared from year to year. Once a baseline is established, region-wide impacts due to a major crash incident, construction disruption, or man-made/natural disaster can be measured. These quantifiable measures can subsequently be used to justify the need for capital improvements and to verify the capital improvement worked to improve a region. For years models have been used to predict the impact on an area, but with the growing availability of probe vehicle data, these predictions can be measured.
Acknowledgments: The authors would like to thank Rick Shuman of INRIX and the I-95 Corridor Coalition for providing the data as part of this study.