Making it happen
A pilot test on the functionality of using existing freeway lanes as autonomous vehicle lanes was completed to quantify the effects that connected and autonomous vehicles (CAVs) would have on the Twin Cities (Minneapolis and St. Paul) metro freeway system in Minnesota. With the current progress of autonomous vehicle manufacturers, vehicles with the technology to increase capacity in a separated lane will be available on the market by the end of the decade. Therefore, the time to plan is now. This timeline suggests that by 2025-2030 CAVs will represent a considerable amount (>10%) of traffic on urban freeway systems, such as those in the Twin Cities.
With future MnPass and other freeway projects planning for the year 2040, CAV modeling should be a part of this capacity analysis of the metro freeway system. The modeled results in this feasibility study will show that even low percentages of CAVs will have a significant improvement in the level of service (LOS) and travel times of the metro freeway system, especially when dedicated lanes are provided for higher volumes.
The I-35W South MnPass Corridor in Minneapolis was chosen as the pilot test for this study due to high peak hour congestion on general-purpose lanes, complex weaving behaviors between I-35W and Highway 62, and segments with and without a dedicated MnPass lane. Freeway and ramp segments were modeled in VISSIM for the 4.5-mile segment of southbound I-35W between 26th Street and Highway 62.
VISSIM models were created to show benefits expected in the general traffic stream under different market penetration rates of CAVs with the existing MnPass Lane and for a dedicated CAV-only lane. Volume and origin to destination assumptions were consistent between all alternatives to show only the benefits or liabilities that CAVs had on the existing freeway system. The existing VISSIM model was calibrated to existing speed and volume data provided by MnDOT, and validated models were used for all CAV modeling.
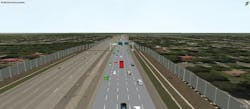
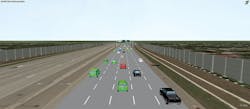
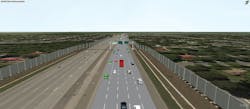
VISSIM models such as these were made to demonstrate the effect of differing levels of CAV market penetration on the driving public.
AV assumptions
One of the advantages of using VISSIM over other freeway analysis programs is the ability to edit driver parameters in detail and mimic CAV-specific behaviors. Internal driving behaviors were calibrated based on PTV recommendations and previous CAV studies, and are expected to have:
- A decrease in distance and headway between vehicles (including lateral);
- Less variability and oscillation at cruising speed;
- Communication with other CAVs during braking and lane changes; and
- Faster reactions than human drivers.
Autonomous vehicles were, for this study, assumed to have moderate benefits over human drivers, which are based off previous autonomous vehicle calibration and current expectations for autonomous vehicles. It is expected that CAVs will provide a minimal operations benefit in mixed traffic situations, but forming platoons of autonomous vehicles when in a separated lane will provide significant benefits. With existing freeway capacity limits in the Highway Capacity Manual (HCM) generally ranging from 2,000-2,200 vehicles per lane per hour, freeway LOS is based on the density of vehicles along that segment of freeway. These capacity constraints are expected to be the same for mixed traffic streams until CAVs are the dominant vehicle type.
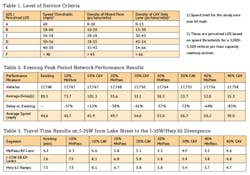
However, the capacity of freeway segments is expected to increase to 3,000-4,000 vehicles per lane per hour or even greater for CAV-only lanes where CAVs can form platoons with limited entering and exiting traffic. This increase in capacity shifts the LOS criteria for CAV lanes (see Table 1). The capacity of CAV-only lanes was calculated to be free-flow capacity based on the VISSIM analysis to be 3,000-3,300 vehicles/lane/mile. This capacity is 50% greater than driver-operated vehicles based on the HCM. Table 1 shows the difference in densities between mixed traffic AVs, as well as perceived LOS, based on the updated capacity and similar speed thresholds.
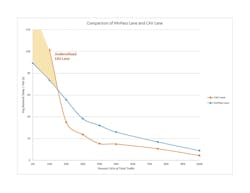
Travel time results showed advantages of MnPass lane (blue) and CAV lane (orange) market penetration rates.
Study results
Existing 2017 volumes were used for this study, but future analysis can be completed as part of a future study. For the MnPass alternatives, a proportional percentage of CAVs were assumed to be high-occupancy vehicles (HOV) rather than single-occupancy (SOV), and the total SOV/HOV capable percentage was assumed to be 20%. These percentages were based off the total traffic stream and were used to match existing MnPass usage of the lane. Link segment results, network travel times and network performance outputs were used from each VISSIM model to compare the benefits of CAVs.
Link segment results: Alternative link segment results were compiled showing ¼-mile length operations results for each alternative and how they changed in volume, density, speed and LOS on the corridor. All CAV alternatives showed improved operations in the basic freeway segments including merging and diverging traffic from the Lake Street/31st Street on-ramp to 35th/36th Street on-ramp. However, congestion formed in advance of Highway 62 is most likely caused by entering vehicles moving left to I-35W and vehicles merging from the left lanes of I-35W to Highway 62. This weaving segment showed a decreasing effect on capacity with low CAV percentage as the weaving interaction created more congestion than the existing model. The weaving area limits capacity in this segment to around 1,700-1,900 vehicles per lane.
Network results: Network results were used to show an overall picture of the effect CAVs had on vehicle operations for the entire freeway corridor. These results in Table 2 are for a two-hour window in the evening peak period from 4 p.m. to 6 p.m. and only for the 4.5-mile segment that was modeled. Network results showed that the MnPass lane as it stands today operated with higher overall speed and less delay than converting it to a CAV lane for less than 15% CAV market penetration rate. When market penetration increased over 15%, a CAV lane allowed CAVs to platoon in the lane and increase the hourly flow rate to over 2,400 vehicles in that lane while still maintaining free-flow speeds. The vehicle capacity of the CAV lane would be estimated between 3,000-3,300 based on the platooning capabilities of future CAVs and as CAV market percentage increases. In addition to the capacity benefit, there also would be an expected safety benefit of separating most CAV vehicles from the general traffic stream; however, quantifying this value requires future research initiative.
Travel time results: Table 3 results show a similar picture to the network results. Times were calculated from I-35W north of Lake Street to the I-35W/Highway 62 divergence. These locations were the same length between alternatives and included 1.5 miles of general-purpose lanes before the separation of the MnPass or CAV lane. The results show the advantages of the existing MnPass lane for low market penetration, the CAV lane for higher market penetration rates, and improvements in the general-purpose lanes except for the 10% CAV scenario. With the travel time segment being 4.5 miles long, the free-flow speed of the corridor is approximately 4.5 minutes (60 mph); 20% CAV modeling shows just over a minute of congestion on the corridor while 40% CAV lane modeling shows that the congestion on the corridor has been reduced to almost no delay.
Future work
Given the rapid development of autonomous vehicle technology, CAVs should be modeled in future conditions analysis to more accurately assess future traffic operations. This study has brought into question what mitigation measures need to be implemented when merging a CAV lane into mixed traffic flow and when to implement a CAV-only lane. These considerations must be analyzed further on a project-by-project basis using detailed origin-destination data and the CAV modeling techniques shown in this study.
Studies like the pilot test for SB I-35W will be important in weighing existing needs versus the eventual improvements provided by CAVs. Ongoing conversations with automakers about how CAV parameters are coded into VISSIM, and in reality are important to understand the interaction between vehicles, will be necessary to provide comprehensive results for future projects.
