How the city of Bellevue, Wash. is using video analytics data to reduce traffic fatalities and serious injuries on its streets

Last year, more than 38,000 people died in car crashes in the U.S. and about 4.4 million people were injured seriously enough to require medical attention.
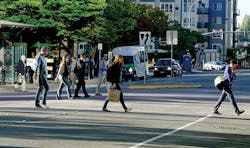
Unfortunately, those annual statistics are not unusual. In response, cities across the nation are turning to a more data-driven approach to reduce collisions and reach their shared goals. The best known of those is Vision Zero, an effort to eliminate traffic fatalities and serious injuries.
The city of Bellevue, Washington is a Vision Zero community that has put in place policies, plans, and programs to improve safety for the traveling public. Efforts such as encouraging people to exercise caution when driving, bicycling, and walking have resulted in a lower per-capita rate of fatal and serious injury collisions than other cities and towns in Washington state. However, there is more that can be done.
In 2019, five people lost their lives and 25 people were seriously injured as a result of collisions on the streets of Bellevue.

Moving Beyond Crash Data
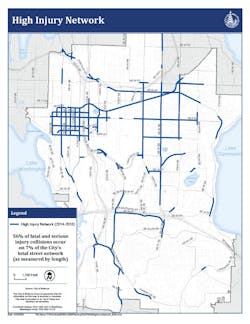
Many governmental agencies continue to rely on traditional traffic safety approaches. They intervene only after enough police crash reports are filed to trigger a High Injury Network corridor designation (Figure 1). This reactive approach to preventing crash recurrence has well-documented limitations:
- At most locations in communities the size of Bellevue (population 145,000), the number of crashes is very small and subject to chance variations.
- Not all crashes are reported, and the level of reporting is uneven with respect to the type of road users involved, the exact location, and the severity of injuries.
- Numerous “close calls” go undocumented.
- Many years of crash data are typically required to develop an understanding of the situation.
Vision Zero calls on government agencies to be proactive, identify risks, and take steps to prevent crashes and eliminate serious injuries and fatalities on our roadways. Vision Zero encourages us to imagine a future in which we do not need to wait for crashes to occur in order to take the necessary preventative steps to keep future crashes from happening.
Solutions for a Safer World
Although traffic collisions can happen anywhere, there are often early warning signals in the form of conflicts or near-collision events at specific locations. These are recurring instances where, for example, a driver routinely speeds, violates a traffic light and comes into close contact with another driver, abruptly stops to avoid crashing into a pedestrian at a crosswalk, or swerves to avoid a bicyclist maneuvering through an intersection. These surrogate warning indicators—observable non-crash traffic conflict events—provide insight into when and where crashes are most likely to occur, and why. Understanding the root causes for near-collision events could enable local governments to take proactive, corrective actions to reduce the potential for future crashes.
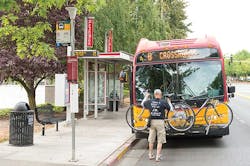
As part of Bellevue’s Vision Zero initiative, the city has partnered with Together for Safer Roads and Transoft Solutions Inc. on a network-wide traffic conflict screening using video analytics based on deep neural networks and cloud computing. This project leverages video footage from Bellevue’s existing traffic cameras to obtain useful data that can be searched, managed, and used to provide traffic management centers with detailed information on traffic volumes, speeds, and other conditions, allowing for a more rapid response to traffic incidents.


Big Data, Big Opportunities
Performance dashboards are presently under development to flag high-risk locations that warrant intervention. The dashboard is based on a predetermined, numeric scale of near-collision conditions normalized with an exposure rate that classifies road users by turning movement (through, left, or right), by direction of approach (northbound, southbound, etc.) and by mode (car, bus, motorcycle, truck, bicycle, pedestrian). Figure 2 reflects this exposure data as aggregated road user volume data at the 40 intersections in this study.
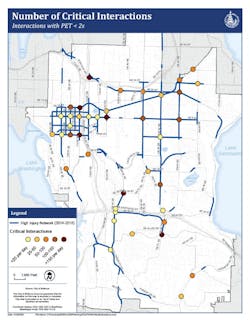
In addition to data on the type and motion of road users at intersections, speed and derivatives of speed can be calculated continuously to better understand steering and braking behaviors. These data have the potential to identify near-collision events using post-encroachment time (PET)—the time between when the first road user and the second road user arrive at the same point. A lower PET indicates a situation where a collision is more likely to occur. The analysis breaks down the PETs into thresholds of two seconds, three seconds, five seconds, and 10 seconds to observe various trends. PETs below two seconds are considered events of concern and require further analysis; 1.5 seconds is the average human reaction time required to prevent a collision (Figure 3).
Predictive Insights to Proactive Interventions
Data generated from the video analytics dashboard offers granular insights and situational awareness that is actionable. For example, the intersection of 124th Ave NE and NE 8th Street is located on the High Injury Network. The dashboard was able to flag this intersection as having one of the highest critical conflict rates after just one week of data.
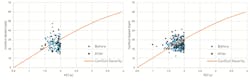
The severity of these interactions can be classified based on the combination of PET and speed values. According to previous research, the probability of a fatal pedestrian injury involving a driver moving at speeds of 20 mph, 30 mph, and 40 mph is 5%, 45% and 85%, respectively. Based on collision probability measured as PET and injury severity measured as driver speed at impact, interactions at this intersection can be classified by the degree of risk into four categories: safe interactions, low severity, moderate severity, and high. The interactions observed during the analysis period are represented as points in Figure 4.
Compared to the other 40 intersections in Bellevue’s network-wide assessment, this intersection had the highest number of critical conflicts with left-turning and through drivers making up 99.6% of all the critical conflicts. This information, as well as high through and left-turn motorist volumes along the east-west corridor, indicated that interactions between left-turning and through drivers are critical at this intersection. Looking at the conflict heat map in Figure 5, the locations at the intersection where there are more conflicts with lower PETs (yellow) are evident.


On September 19, 2019, the signalization for left-turning drivers at the intersection changed from a permissive left-turn signal phase for northbound and southbound to a protected-permissive left-turn signal phase. After the changes were implemented, a seven-day before-after study was conducted to observe changes in safety. Using the video analytics and dashboard, this study was completed in two days. The frequency of critical conflicts decreased by 60% for conflicts between southbound through and northbound left-turning drivers, and by 65% for conflicts between northbound through and southbound left-turning drivers from before to after (Figure 6). Video analytics allows for fast and detailed analysis; it helps practitioners quickly assess new changes so they can continue their work or make adjustments if needed.
The video analytics can also be used to analyze other indicators affecting or contributing to the severity of a crash, such as high speeds and speeding incidents. The intersection of Bel-Red Road and NE 30th Street (Figure 7) was flagged as the intersection most prone to speeding incidence on the dashboard, even though it is not located on the High Injury Network. A deeper analysis was conducted on individual movements to pinpoint the root cause. The speed heat map shows that speeds are higher for the southbound through movement followed by the northbound through movement.
Using the metrics provided by the video analytics (volume, speed, and speeding patterns) in conjunction with the features on the dashboard (trajectory maps, heat maps, and videos of speeding events), diagnosis of speeding incidence was also possible to complete from just one week’s worth of data. Speeding analysis indicated that the southbound through speeding patterns occurred exiting the intersection. Upon looking at the speeding event videos, multiple yellow- and red-light crossings were observed on an hourly basis. An example of such an incident is shown in Figure 8. The analysis provides the city with insight when looking at signal timing plans for this intersection.
The National Highway Traffic Safety Administration has quantified the economic and societal impact of crashes in the U.S. at more than $800 billion annually. The use of near-collision data is an efficient and cost-effective approach to improving safety. In terms of human lives and property damage, these events are zero-cost learning opportunities, compared to learning from actual crashes and their grim consequences.