Monitoring Structural Performance of the Williamsburg Bridge
Lehigh University researchers have been on the forefront of field instrumentation and testing of bridges, buildings and other structures for over 50 years. They have developed a vast database and considerable experience in the field testing and evaluation of highway and rail structures. Field testing and evaluation is a particularly challenging area of structural research. It is the only method to accurately evaluate the true behavior of a structure in real-time under actual loads. Field measurements are the link that connects and validates laboratory testing and computer modeling to the behavior of real structures. It is well known that accurate interpretations of structural behavior require accurate data. However, it is clear that it is much more difficult to collect data several hundred feet in the air over a river, in the wind and cold, than it is in a laboratory. Aside from environmental obstacles, there are many variables that must be addressed prior to making an accurate interpretation of the measurements. Thus, a thorough understating of data acquisition systems, sensors and structural behavior is essential. Of utmost importance is a data acquisition system that can consistently perform under these adverse conditions.
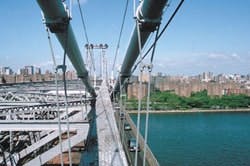
An example of a recently completed field-testing project involves on-site measurements and long-term remote monitoring of the Williamsburg Bridge in New York City, which is currently undergoing a major rehabilitation. A significant portion of this project involves the replacement of the existing concrete-filled grid deck on both the south and north inner and outer roadways with a steel orthotropic deck.
Along with a comprehensive laboratory testing program, an in-depth field instrumentation and testing program was also conducted on the south outer roadway. This study was performed to investigate in-situ stress ranges and better characterize the behavior of this complex structural system and its relationship to the laboratory response. Data were collected using a CR9000. During controlled load tests, data were collected from 82 strain gages at sampling rates as high as 200 Hz. All data were temporarily stored on PCMCIA cards installed in the datalogger. These data were subsequently copied to the laptop at the end of each test for processing and back up. The ability to observe and review data in real-time was invaluable during the testing.
These channels monitored as triggered time histories were automatically re-zeroed on the whole and half hour using a digital balance algorithm. The appropriate length for the buffer and total recording time were determined on site. This technique provided sufficient time-dependent data and a method of verification for high-stress range events to ensure that spurious signals were excluded from the stress-range histograms. Stress-range histograms were developed using the rain-flow cycle counting method contained in the CR9000’s instruction set. The stress-range histograms were generated continuously and did not operate on triggers, thus all cycles were counted. In addition, the histogram was updated every 10 minutes. Thus, in the event of a power failure, a minimal amount of data were lost. The stress-range bins were divided into 0.5 ksi intervals. The results of the research will be incorporated in the AASHTO LRFD Bridge Design Specifications.