Evaluation of alternative work zone split traffic symbol sign
Figure 1. Work-zone site location map.
Effective signage that is easily understood facilitates safe driving through a work zone. The Manual on Uniform Traffic Control Devices (MUTCD) (1) provides guidance on signage for temporary traffic control (TTC) in work zones. While the MUTCD guidance is suitable for many conditions, there may be instances where alternative signage may be more effective at enhancing safety.
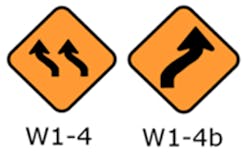
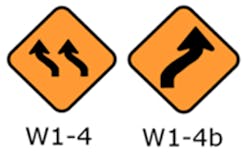
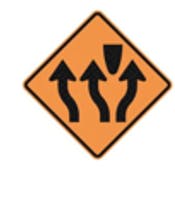
In this project, the use of an alternative sign for closure of a middle lane in a freeway work zone was evaluated based on its implementation at a work zone for a Missouri bridge rehabilitation project on I-170 near I-70 in December 2016 as shown in Figure 1. The work zone activity called for the shifting of three lanes, two lanes around one side and one lane around the other side of the work area. The MUTCD signs and the alternative sign tested in this study are shown in Figure 2. The alternative sign presented in Figure 2(b) displays the lane arrangement in a single sign which is posted on both sides of the freeway.
The southbound work zone split signs were posted December 7, 2016, and the northbound split signs were posted December 10, 2016. The signs in both directions were removed on December 21, 2016. Due to the short duration of the work zone, it was not possible to implement the MUTCD signs for comparison with the alternative sign.
The evaluation included the following components:
- Collection and analysis of field videos to assess driver behavior
- Stakeholder interviews with Missouri DOT (MoDOT) personnel and contractors to understand their perception of the alternative sign
- Investigation of driver responses on MoDOT’s “Rate Our Work Zones” website
- Collection and analysis of crash data for the work zone period and the time period before the work zone was implemented
- Collection and processing of the Regional Integrated Transportation Information System (RITIS) travel-time data to investigate operational impacts
Figure 2. Middle lane closure warning signs (a) from MUTCD Section 6F (1) (b) alternative warning sign.
VIDEO DATA COLLECTION AND ANALYSIS
Methodology
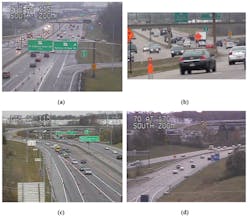
To help gain insights into driver behavior with the new sign, video data were collected and analyzed. Both stationary and drive-through videos were collected from the work zone for 20 analysis periods based on the stage of construction (early or late construction), direction (northbound or southbound), and time of day (a.m. peak, p.m. peak, nighttime, weekday midday, and weekend midday). The drive-through videos were used to help understand the driver’s perspective of the sign and evaluate sign visibility. Stationary videos were processed to derive traffic counts and to evaluate driver behavior, including lane changes and unusual vehicle maneuvers. For the stationary videos, footage from four camera views was recorded as shown in Figure 3. Three of the four camera views utilized the permanent MoDOT closed-circuit television (CCTV) cameras while the other view was from a portable camera deployed on a tripod. Various performance measures were obtained through the visual processing of the stationary videos for the northbound back view and southbound front view. These performance measures are as follows:
- Vehicle counts by lane
- Number of lane changes by initial and final lane
- Time headway between lane change location and split signs
- Time headway between lane change location and gore point
Results
As determined from the drive-through videos, the average distance at which the signs became visible was around 1,637 ft in the northbound direction and around 1,043 ft in the southbound direction. These distances were based on a travel speed of 45 mph at the speed limit and travel times of 24.8 seconds in the northbound direction and 15.8 seconds in the southbound direction. These lead times indicate that the sign was sufficiently visible to drivers.
A total of 32,350 vehicles were counted during the 20 analysis periods. The flow rates for the a.m. and p.m. peaks were approximately 30% to 40% higher than the flow rates during midday on a weekday. The nighttime flow rates were generally the lowest, although the weekend flow rates were lowest for the northbound late construction period. The middle lane had the highest traffic counts for most of the analysis periods.
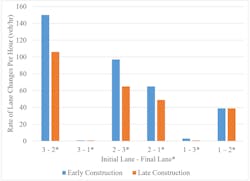
Lane changes over the 20 analysis periods were also processed manually from the videos. The results (Figure 4) show that most lane changing activity occurred between the outside and middle lanes. The gore point was also located between the outside and middle lanes. Thus, the majority of the lane changing activity occurred upstream of the gore point location. In addition, the average lane change rate generally decreased between the early and late construction periods. The percentage of vehicles starting in the outside lane before the work zone that remained in the outside lane increased from 73.8% in the early construction period to 85.7% in the late construction period. The decrease in lane changing activity during the later stages of construction may be due to drivers becoming more familiar with the work zone layout and signage as construction progressed. On average, vehicles changed lanes 8.32 seconds after the split signs and 7.97 seconds before the gore point. The locations of the lane changes relative to the split signs and gore point remained unchanged throughout the period of time when the split signs were in place.
Some unusual driver behavior was observed in the videos, including aggressive lane changes before and at the beginning of the gore point, vehicles driving across the lane closure area, and vehicles being stranded in the gore. The unusual driver behavior generally appeared to be related to aggressive driving and not to the presence of the alternative sign.
Figure 3. Screenshots of camera views (a) northbound front view stationary video (b) northbound back view stationary video (c) southbound front view stationary video (d) southbound back view stationary video.
STAKEHOLDER AND DRIVER SURVEYS
To gain further insights into the possible impacts of using the alternative sign, interviews were conducted with four contractor personnel and five MoDOT personnel familiar with the project. The general consensus of the interviewees was that the alternative sign was a positive option because it communicated information more clearly than the MUTCD signs. However, the respondents had different perceptions on the impacts of the sign on work-zone safety for drivers and construction workers. Some respondents thought the alternative sign improved safety while others indicated that the safety level was the same because they do not think that drivers pay attention to the signs. Respondents did not think that the use of the alternative sign had any effect on work-zone delays.
The opinions of another important stakeholder group, drivers, were also sought. Due to the high speed and high traffic volumes on this corridor, it was not deemed safe to conduct a driver intercept survey. In lieu of a driver intercept survey, the survey responses from MoDOT’s “Rate Our Work Zones” survey were reviewed to determine if drivers gave any feedback regarding the use of the alternative signs. MoDOT’s “Rate Our Work Zones” survey (2) is a web-based customer survey that records driver perceptions of work zones across Missouri. Drivers who completed the survey did not express any concerns regarding the use of the new split signs on the I-170 project.
Figure 4. Lane changes during early and late construction periods.
CRASH DATA ANALYSIS
Methodology
Another important aspect of evaluating the alternative sign was to assess its possible safety impacts. To perform this evaluation, crash data were reviewed for the work zone period as well as a period of time before the work zone was implemented. Understanding the crash patterns for this section of I-170 before the work zone was in effect constituted an important part of the safety evaluation. Crash data for the period beginning January 1, 2015 and ending November 29, 2016 were used to evaluate safety under non-work zone conditions.
Results
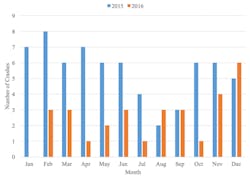
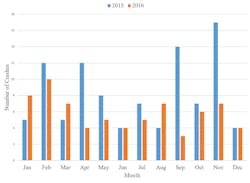
A total of 265 crashes occurred in 2015 and 2016 on this section of I-170 between I-70 and St. Charles Rock Road. The most common types of crashes were rear-end, out of control, and passing crashes. As shown in Figure 5, the number of crashes generally decreased from 2015 to 2016, and there were 13 crashes on this section of I-170 while the work zone was in place. The crash patterns during the work zone period were similar to the crash patterns before the work zone was in place. Almost all of the crashes during the work zone period were due to lane changing, passing, or rear-end collisions, although there was one crash caused by a vehicle losing control. A detailed review of the crash reports found that the use of the alternative sign did not appear to be a contributing factor to any of these crashes.
Figure 5. Crashes by month (a, top) I-170 southbound (b, bottom) I-170 northbound.
TRAVEL TIME ANALYSIS
Methodology
In addition to the safety analysis, travel times between the work zone period with the alternative sign and the non-work zone period were compared using travel-time data from RITIS. Travel-time analysis was conducted on the I-170 work zone segment and its vicinity, including sections of I-170 upstream and downstream from the work zone and adjacent routes (I-70 and Natural Bridge Road). Two measures using historical information were utilized for quantifying the operational impacts of the work zone: travel time difference analysis based on historical three-week average travel time for the segment (HATT) and travel-time difference analysis based on travel time for the segment one year ago (HYTT).
Results
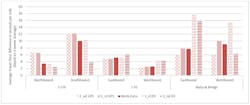
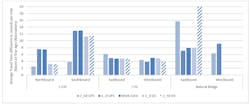
The average HATT and HYTT values are shown in Figure 6. The results show that there was a minor travel time increase of a few seconds during the time that the alternative sign was present in the work zone. The small increase had minimal impact on travel times through the work zone. From these results, it can be concluded that the use of the alternative sign in the work zone did not significantly affect operations on I-170 or its adjacent corridors.
Figure 6. Average travel time differences (a, top) HATT (b, bottom) HYTT.
CONCLUSION
The findings from the study can be summarized as follows:
- Drivers seemed to generally accept the alternative signage because no concerns regarding the use of the sign were submitted through the MoDOT driver survey website.
- The use of the alternative sign did not create any adverse safety impacts. Crash patterns during the work zone period were similar to the crash patterns before the work zone was in place, and the use of the alternative sign did not appear to be a contributing factor in any work-zone crashes.
- Lane changing behavior decreased as the construction progressed.
- Instances of aggressive driver behavior were observed in the videos, but these instances do not appear to be related to the use of the alternative sign.
- The use of the alternative sign did not cause any adverse operational impacts in the work zone and surrounding area.
- MoDOT personnel and contractors familiar with the project believed that the alternative sign helped to communicate information clearly but had mixed perceptions on whether the use of the sign improved safety. Some respondents believed that drivers simply do not pay attention to signs.
In summary, the investigation of the use of the alternative sign on the I-170 project found that the alternative sign has great potential for use on freeway work zones with lane closures in the middle lane. The stakeholders believed that it communicated information more effectively to drivers, and the use of the sign did not appear to create any adverse impacts for operations or safety.
This study could potentially be expanded in the future to investigate the impacts of the alternative sign in greater detail. While the scope of this project was limited to a field study, a possible future simulator study could be used to compare scenarios with both the MUTCD signs and alternative sign and to survey drivers directly regarding their perceptions and preferences.
--------------------
REFERENCES
1. Federal Highway Administration (FHWA). 2009. Manual on Uniform Traffic Control Devices for Streets and Highways (MUTCD). Federal Highway Administration, Washington, DC.
2. Missouri Department of Transportation (MoDOT). 2013. MoDOT Work Zone Customer Survey. Missouri Department of Transportation, Jefferson City, MO. https://www.modot.org/work-zone-customer-survey. Accessed March 4, 2019.
