On the application of NMPRDS data to corridor performance evaluation
In an effort to inform traffic performance management, operations and planning using big data, the Federal Highway Administration provides access to fine-resolution travel-time data to state agencies and metropolitan planning organizations (MPOs). The National Performance Management Research Data Set (NPMRDS) consists of travel-time information for passenger cars and freight vehicles collected at five-minute intervals on traffic message channels (TMCs). The latter are roadway segments of varying lengths that cover roadways in the National Highway System (NHS). The NPMRDS, which can be downloaded by state DOTs and their partners, includes GIS shape files with the location of each TMC.
The Center for Transportation Research at The University of Texas at Austin (CTR) explored the use of NPMRDS to support meaningful corridor-level performance metrics computation on a 20.2-mile section of the U.S. 281 corridor in San Antonio, Texas. Aside from computing some typical performance indicators on the corridor, CTR studied the impact of data aggregation techniques on the resulting metrics, and the use of TMC-level data to identify atypical traffic conditions.
In recent years, the transportation industry has seen a boom in the data-driven decision making. The high temporal granularity of the NPMRDS and extensive coverage has enabled researchers and agencies to use the dataset for multiple purposes, with corridor performance metrics being a popular application across agencies. Previous work has described the use of this data such as planning time index, travel time index, AASHTO reliability indexes, congested hours and congested miles. In addition, NPMRDS has been applied in combination with other data sets to validate or compare travel-time predictions, used for before and after analysis as well as for calibration of models.
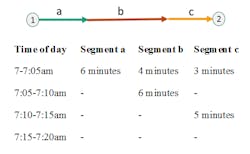
One focus of the San Antonio case study was to analyze the influence of the approach used to aggregate time-varying travel-time data across TMCs in order to compute corridor-level metrics. CTR compared the outcomes of two typical approaches for time-varying segment data aggregation: instantaneous and time-dependent. The instantaneous travel time for a selected departure time is defined as the sum of mean travel times on all TMCs at the considered departure time. The time-dependent travel time (also called experienced travel time) is the travel time on all TMC segments reported at the corresponding time of arrival.
Figure 2. Instantaneous aggregation of travel times.
For example, consider a corridor divided into three segments for which five-minute travel-time data is available during the morning peak. The total corridor travel time from 7:00–7:05 a.m. computed using an instantaneous aggregation approach is 6+4+3=13 minutes, whereas using time-dependent aggregation yields 6+6+5=17 minutes by taking into account the time of arrival at each downstream segment. Although instantaneous aggregation may result in misleading travel-time predictions, it is an easy-to-compute statistic and therefore useful for posting real-time travel-time estimates on variable message signs used for managed lanes or a general freeway.
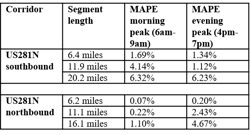
To quantify the error in using instantaneous travel time as an estimate of experienced corridor travel time, we compared the two travel times across the northbound and southbound directions of the U.S. 281 N corridor on varying lengths. Table 1 presents the mean absolute percent error (MAPE) between instantaneous and experienced travel times.
Table 1. Mean absolute percent error (MAPE) between instantaneous and experienced travel times along US 281 N corridor.
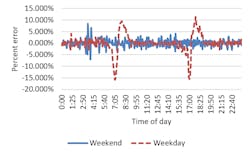
The percentage error of instantaneous travel time when compared to time-dependent travel time is higher during the morning and evening peaks on weekdays. During weekdays, MAPE value is 6.32% around the morning peak and 6.23% around the evening peak—a reasonably small percentage error. CTR also observed that MAPE values are higher for longer segments, indicating that the error in instantaneous aggregation increases with the length of the segment.
Figure 3. Variation of percent error in two travel times according to time of day.
Overall, instantaneous and experienced travel times do not show significant variation in the San Antonio case study, which suggests that instantaneous travel times are appropriate for corridor performance evaluation at this location. Further, given that the MAPE value is less than 7% during peak periods, instantaneous aggregation methods may be acceptable for displaying route travel times on variable message signs.
Analysis of day-to-day variations in travel times provided by the NPMRDS is helpful in understanding whether a day is representative of the typical traffic conditions often used as a reference in transportation systems planning and evaluation. From a traffic operations perspective, identifying atypical days may have an impact on traffic management decisions. From a planning perspective, it may provide a better understanding of demand variability or unstable traffic conditions.
In the second focus of the San Antonio case study, CTR quantified the number of atypical days along the corridor. CTR measured the deviation of travel time function of an -th day from a typical day by calculating mean absolute error () defined as the mean absolute difference between the travel time on the i-th day and the median travel time.
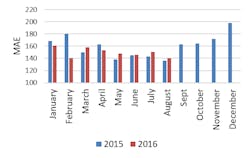
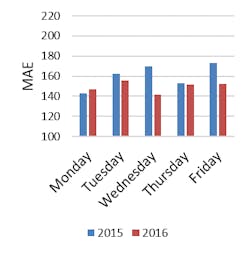
Figure 4. Variation of average MAE evaluated for each month and each weekday analyzed.
As illustrated in Figure 4, August had the lowest average MAE in 2015. February, November, and December had high MAE values, indicating a greater prevalence of atypical days. Mondays were found to have the lowest MAE in 2015; Wednesdays were found to have the lowest MAE in 2016. However, the difference in the average MAE errors is not significant enough to make a conclusive argument. In general, a mean-absolute error (MAE)-based measure may be another useful statistic to quantify corridor performance on a particular day, and it may be useful in applications like evaluating road-user costs for construction projects.
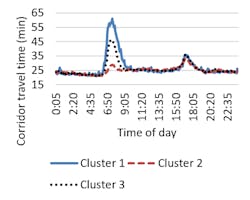
CTR then used an unsupervised learning algorithm to identify patterns in the data set to aid in quantifying the percent of atypical days. Figure 5 shows the corridor travel time obtained for each cluster centroid. For three clusters, means classified 9.63% of days in cluster 1, 41.9% in cluster 2, and 48.4% in cluster 3, suggesting that 9.63% of days in a year are atypical for the U.S. 281 N corridor. Figure 5 also shows that the variation of travel times between cluster centroids is negligible during times other than morning peak, suggesting that in this case atypical days often involve travel demand changes (or network disruptions) during the morning peak.
Figure 5. Corridor travel times obtained for each cluster centroid in the case study.
Overall, the methodologies proposed in the San Antonio case study have interesting implications. First, the analysis suggests that the instantaneous aggregation of corridor travel time provides a reasonably good estimate of the experienced corridor travel time (MAPE value less than 7% during peak hours for a corridor length of 20.2 miles) and may be used for planning applications, and even for operational use cases if similar data is available in real-time. Further, the study also supports the use of NPMRDS data to estimate travel times on a particular day, which may help obviate manual field data collection while enabling before/after analyses that consider longer time periods and cover more times during the day. A second implication is that the proposed methods can help an agency identify the number of atypical days on a given corridor and to develop insights into the possible reasons for atypical conditions based on when they happen. Such techniques also can support the evaluation of the cost of disruptions on an atypical day. Additionally, the analysis encourages the use of NPMRDS data to obtain travel-time measurements for a particular day, which may help obviate the manual field counts conducted for some projects. Data sets such as the NPMRDS provide a unique opportunity for agencies and researchers to collaborate in developing a better understanding of the potential value of traffic data and novel data analysis techniques to enhance transportation systems.
The authors would like to thank TxDOT San Antonio District for providing access to NPMRDS.
