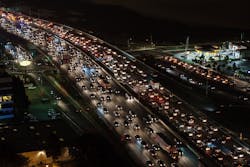
TRAFFIC MANAGEMENT: Data shows drivers in America continue to spend more time stuck in traffic
According to new data from the U.S. Department of Transportation’s (U.S. DOT) Federal Highway Administration (FHWA), drivers are spending more time stuck in rush-hour traffic than ever.
Based on data from America’s 52 most populous metropolitan areas, FHWA’s “2016 Urban Congestion Trends” shows that average congestion worsened, with drivers spending an additional three minutes stuck in traffic compared to 2015—with some areas improving and others deteriorating.
Congestion got worse during peak hours in 2016, as represented by the Travel Time Index, which compares peak-hour or commuter travel times to free-flow travel times. The index increased slightly to 1.35 in 2016 from 1.34 in 2015, meaning that a trip taking 10 minutes in free-flow traffic would now take 13.5 minutes during peak hours.
Other measures in the report showed a slight improvement, including the Planning Time Index, which went from 2.65 in 2015 to 2.62 in 2016. The Planning Time Index indicates how long a traveler should plan for a trip to ensure an on-time arrival. As traffic worsens, the score increases.
In this case, a traveler planning a trip that would take 30 minutes in ideal conditions should plan on a close to 78-minute trip to ensure an on-time arrival.
Recognizing that American cities depend on efficiently moving traffic, the U.S. DOT believes these new data underscore the need to invest in technologies to make that happen. The department is acknowledging the critical need to give better and timelier information about road conditions to drivers and traffic managers.
---------
Source: U.S. DOT
