Safety shaped
The diverging diamond interchange (DDI) has recently become a popular alternative to other forms of interchange designs.
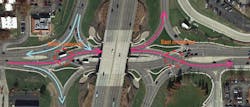
Since the first DDI installation in Springfield, Mo., in 2009, there have been 47 locations across the U.S. where DDIs have been installed. An example of a DDI in St. Louis, Mo., is shown in Figure 1, in which the freeway runs north and south while the crossroad runs east and west. Two ramp terminals are shown—west crossover and east crossover. The DDI operates as follows. The west-to-east movement is shown as blue arrows in Figure 1 (see page 18). At the west crossover, the eastbound through and left-turn traffic crisscrosses the westbound through traffic. Then the eastbound left-turn movements have a free left onto the northbound freeway, while the through traffic proceeds and crisscrosses the westbound through and left-turn traffic. Thus, vehicles drive on the “wrong” side on the crossroad between the two crossovers. The traffic that travels from east to west experiences the same crossovers.
The operational benefits of a DDI compared to other designs have been documented in several past studies. However, the safety performance of a DDI has not been comprehensively evaluated in past research. This article addresses the safety of the DDI through a before-and-after evaluation using data obtained from six sites in Missouri.
Missouri was the first state to have built a DDI and at the state level has the largest number of DDIs built or under construction (15 as of 2015). The safety evaluation consisted of the Empirical Bayes (EB) observational before-and-after evaluation method. Crash modification factors (CMF) for total, fatal and injury, and property-damage-only crashes for a DDI were developed. The CMF values provide the expected reduction in crashes achieved by a DDI as compared to a conventional diamond interchange.
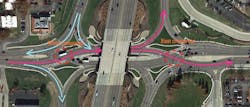
DDI at I-270 and Dorsett Road, Maryland Heights, Mo.
Less prone to accidents
The before-and-after safety analysis of DDI designs implemented in Missouri was conducted using data from six DDI sites. These sites were opened to traffic between 2009 and 2012. Table 1 contains the following characteristics of the DDI locations: traffic volume, the duration of before-and-after periods and geometric characteristics. All six DDI designs replaced conventional diamond interchanges. Pedestrian crossings were implemented in the median except for I-270 and Dorsett, and Chestnut Expressway and Rte. 65. For the configuration type, O stands for overpass and U stands for underpass. Crash data was collected for the entire interchange footprint during the study periods reported in Table 1. The footprint included the influence areas of all interchange components. For the freeway, crashes were included from the beginning of speed-change lanes to end of speed-change lanes in both directions of travel. For the crossroad, all ramp terminal-related crashes and crashes occurring on the crossroad segment in between the two terminals were collected.
The severity of crashes was studied for the before-and-after periods. The crash-frequency data was classified into two categories: fatal and injury crashes (FI) and property-damage-only (PDO) crashes. Annual crash frequencies for the two categories before and after the DDI construction are shown for all sites in Figure 2. The crash frequency for FI crashes decreased at all sites after DDI implementation. The greatest decrease was witnessed at the I-270/Dorsett site (which had the highest average daily traffic of all sites). With the exception of two sites, the PDO crashes also decreased after DDI implementation. The sum of PDO and FI crashes also decreased at all sites after DDI implementation. For example, the I-270/Dorsett site had a total of 150 crashes (117 PDO + 33 FI) before DDI and 75 crashes (65 PDO + 10 FI) after DDI.
The Empirical Bayes (EB) method has been used in previous studies to evaluate the safety effectiveness of alternative intersection designs. The EB method also is recommended by the Highway Safety Manual (HSM) for conducting safety evaluations. Using safety performance functions (SPF), the EB method estimates the average crash-frequency for treatment sites during the after period as though the treatment had not been applied. The expected crash frequency is calculated as the weighted average of the observed crash frequency and the SPF-predicted crash frequency. The comparison of expected crash frequency and observed crash frequency for the after period forms the basis for deriving safety effectiveness. For the project-level analysis, the predicted crash frequency for the whole interchange was obtained by summing the predicted values for all interchange facilities (ramp terminal, crossroad segment, speed-change lanes, ramp segments, etc.). The expected interchange crash frequency was calculated using a weighted average of all the facilities of an interchange, taking into account correlations among the facilities as recommended by the HSM.
The results of the EB method are shown in Table 2. Here, the observed crashes, the EB expected crashes and the safety effectiveness values for each site are reported in different rows. The standard error values also are reported in parentheses next to each safety-effectiveness value. The right-most column provides the results for the entire treatment group (combination of all six sites). For the entire treatment group (‘All Sites’ column in Table 2), the percentage reduction in crashes was the greatest for FI crashes, at 62.6% compared to the 35.1% for PDO and 40.8% for TOT crashes (TOT denotes total number of crashes: PDO and FI). These findings are consistent with the results of the crash-frequency analysis presented in Figure 2.
The EB results for individual sites (see Table 2) showed that the DDI was effective at decreasing the FI crashes at all six sites, although the reduction at the sixth site was not statistically significant at the 95% confidence level. The PDO crashes also decreased at all six sites with the reductions statistically significant at all but sites 3 and 6. The TOT crashes also decreased at all six sites and the reductions were statistically significant at all but site 6. The lack of statistical significance of the EB results for site 6 was due to two reasons. First, the duration of the after period for site 6 was the smallest among all six sites at 10 months. Second, the observed crash frequencies per year before DDI (10 FI, 24 PDO, 34 TOT) and after DDI (9 FI, 24 PDO, 32 TOT) were not considerably different. ST