Choosing countermeasures
Countermeasures are used to help makes roads safer by reducing crashes. However, while we often know that they reduce crashes we usually do not know the exact effect they have on driver behavior and how this reduces crashes. However a new data set from the Second Strategic Highway Research Program (SHRP 2) provides researchers an opportunity to study just that.
SHRP 2 conducted a Naturalistic Driving Study (NDS), which is the largest and most comprehensive done to date. The NDS was conducted by Virginia Tech Transportation Institute (VTTI) from 2011-2013. During this time span approximately 3,000 volunteer drivers of both genders with ages ranging from 16 to 98 had their cars equipped with sensors and cameras to monitor their everyday driving for anywhere from six months to two years. Participants in the study were recruited from six states across the United States: Florida, Indiana, New York, North Carolina, Pennsylvania and Washington. However, since this was a naturalistic driving study, drivers may have driven outside of these states.
The study collected a variety of data through a data acquisition system (DAS) at a rate of 10 Hz. This included data such as speed, acceleration, lateral position, gas, brake and steering wheel position in addition to radar. Additionally, every second GPS coordinates also were extracted so one could geo-locate where the driving was occurring.
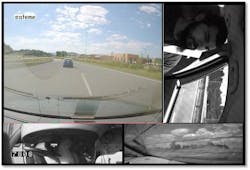
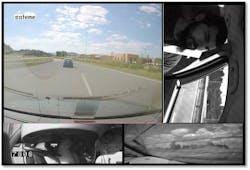
One of the most unique aspects of the study was the inclusion of cameras to capture not only what was going on outside the vehicle, but also within. Four cameras were installed in each vehicle and included a forward and rear view along with a video of the drivers face and a view over the shoulder. An example of these views is seen in Figure 1. The forward and rear cameras provide context to the driving situation, while the camera views of the inside of the car allow researchers to be able to determine not only where the drivers were looking, but also if any distractions were present.
The NDS was unique as it not only included data on drivers in normal driving situations, it also included crashes and near crashes. In total there were approximately 1,800 crashes and over 6,000 near crashes. These crashes and near crashes provided valuable insight as data were gathered on what lead to the crash, including things such as driver distraction.
Figure 1
In conjunction with the NDS, a Roadway Information Database (RID) also was collected. Using mobile data collection the RID collected data for 12,500 centerline miles or 25,000 lane miles of roadways where drivers drove in the NDS. Rural and urban roadways from all six states were included in this database. Data collected included horizontal curve features, lane and shoulder types and widths, grades and superelevation, presence of signs, barriers, lighting, rumble strips, median presence, and type along with intersection information such as location and control. In addition to the mobile data collection, roadway data from existing sources such as the Highway Performance Monitoring System and DOTs were included as well as supplemental data such as crash histories, traffic data, and construction work.
In an ongoing study sponsored by the Federal Highway Administration, Iowa State University researchers used this NDS and RID data to try to better understand driving behavior at rural intersections and determine which countermeasures are most effective and what behaviors they tend to change. Rural intersections are the location of approximately 30% of all rural fatalities. Many countermeasures are implemented at these rural intersections, and currently CMFs are the main way to compare the different options. As crashes are often rare, choosing countermeasures, which not only help to reduce crashes but also reduce risky behaviors that may lead to these crashes, is beneficial.
In the first phase of this study, which was completed in 2016, researchers tried to understand what was happening during safety critical events (i.e. crashes and near crashes). They also tried to address two behaviors, which are thought to lead to crashes at rural intersections, drivers not stopping before entering the intersection and selection of appropriate gaps. Various conceptual models were developed to determine if they were able to measure the effectiveness of countermeasures relating to these behaviors.
When examining safety critical events for rural intersections simple statistics showed that almost 75% of drivers did not make a full stop, with the majority making a rolling stop (60%). It was also found that the majority of events occurred during the day in dry conditions and that over half of all drivers (57%) were engaged in some type of a distraction.
To address how countermeasures affect stopping behavior at intersections, an analysis was conducted for stop-controlled approaches at study intersections. Stopping behavior was characterized by: full stops (min speed ≤ 0.5 mph), rolling stops (> 0.5 and < 5 mph), and no stops (≥ 5 mph). A model was run, and a correlation was found between crash histories, movement (i.e. left, right, through) and roadway features, such as the approach grade and stop bar presence, and the propensity to stop.
Figure 2
Gap behavior was evaluated using a gap acceptance model. The model assessed how driver characteristics as well as roadway and environmental features impacted the size of gaps accepted. The analysis modeled acceptable versus unacceptable accepted gaps. An acceptable gap was defined as more than the critical gap outlined in the Highway Capacity Manual while an unacceptable gap was a gap less than the critical gap. An unacceptable gap corresponded to a gap of less than 6.2 seconds for a right turn, 6.5 seconds for a through movement and 7.1 seconds for a left turn. The analysis only included eight unacceptable gaps, and was only able to draw a relationship between the length of time the driver waited for a gap and the acceptance of an unacceptable gap.
Additionally, the team evaluated where drivers begin reacting to the upcoming intersection by evaluating reaction point. The researchers developed a model to determine where drivers began breaking upstream of the intersection while another used statistical change point models to determine when speeds decreased upstream. Initial results found drivers begin reacting to intersections approximately 260 meters upstream on a 55 mph road when looking at braking and 250 meters upstream when looking at speeds. From the model a correlation also was found between certain countermeasures (e.g. on pavement signing (Figure 2)) and the distance at which drivers begin braking. A driver’s speed on the approach also was found to be a significant effect. Additionally a model was developed using a subset of the braking data, which also included driver distraction. It found that as drivers are distracted they began braking later and that certain countermeasures may help to better gain the attention of these distracted drivers.
In Phase 2 of this study, which is currently underway and expected to finish in summer 2019, researchers will expand on the Phase 1 study to include more samples with more countermeasures present. Additionally, while Phase 1 focused on only two-lane/two-lane rural minor stop controlled intersections, Phase 2 also will include rural four-lane/two-lane minor stop controlled intersections as well as including rural all way stop controlled intersections. In Phase 2 researchers will try to incorporate the limited number of crash and near crashes at rural intersections to determine which roadway characteristics may be overrepresented.
The hope is the results of Phase 2 will result in quantified impacts of rural intersection countermeasures, which can be used by agencies to better select resources to address a particular problem at their intersection. This may include a table showing the impact of various countermeasures on stopping behavior which can be used by agencies to address an intersection with a history of crashes, which suggest failure to yield was a critical problem.


