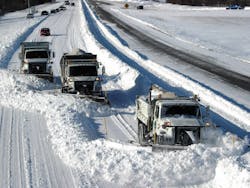
Snow and ice operations are a signature function of the Ohio Department of Transportation (ODOT).
Snow and ice directly impact our customers’ daily routines in the winter months, and it is the department’s most visible operational function done by ODOT forces. Reflecting its importance, ODOT dedicates an extensive amount of resources toward snow and ice operations. It is critical to measure the effectiveness of these costly expenditures. As such, ODOT developed a Snow and Ice Performance Evaluator to objectively rate its winter-maintenance performance. The program supports ODOT’s guiding principle: being the standard of excellence for winter maintenance.
Seeing it through
More than 3,000 of ODOT’s employees are involved in snow and ice control in some way, with the department using an average of 700,000 tons of salt and operating more than 1,700 plows over 43,000 lane-miles during a typical winter. An average winter costs ODOT $50 million. With so much invested, ODOT leadership deemed snow and ice control a critical success factor (CSF) for the department. The leadership emphasized measuring ODOT’s performance objectively across the different CSFs for each division. Previous performance measurements were very subjective, relying on county managers to report their own snowfall totals and clearance efforts. The Snow and Ice Performance Evaluator was developed to rate ODOT’s performance through an entirely data-driven analysis.
First and foremost, appropriate criteria for the program needed to be established. ODOT has a stated mission of providing the easy movement of people and goods from place to place. As such, ODOT’s success should derive from the direct impact to the motoring public. Drivers of Ohio’s roadways carry an expectation of travel times for their routine trips. Snow and ice events adversely affect the ability to travel at expected speeds. Drivers expect roadways to be passable soon after a snow event has ended, which means they expect to resume traveling at their normal speed. Thus, the metric was established as a measurement of the amount of time it takes ODOT crews to recover travel speeds back to their expected levels. This metric ties ODOT’s operational success to its customers’ expectations, which is in support of the department’s mission statement.
A completely objective measurement requires strong and reliable data. Two separate types of data, speed and weather, are utilized in the Snow and Ice Performance Evaluator. ODOT holds a contract with Inrix to access its historical speed data. Inrix combines numerous speed-data sources into a data-fusion engine. It then outputs speed data into tens of thousands of individual segments of roadway. A “route,” as defined in this program, comprises many of these individual segments matched to the limits that ODOT maintenance forces are responsible for. For example, I-71 in Franklin County is a route that is monitored for Franklin County’s performance. The speed data is easily retrievable on a temporal and geographical basis. Roadway speeds for most ODOT maintenance priority routes are available from Inrix. ODOT also maintains a comprehensive road weather information system (RWIS). There are more than 170 RWIS stations across Ohio capturing surface-level weather information such as precipitation, air temperature and wind speed. These two data sets empowered ODOT to test its program using historical data via rigorous modeling of previous winter-weather events.
The program analyzes the speed and weather data to model winter-weather events. All data is organized chronologically and geographically to model each event. A snow event can be visualized as a three-part timeline: the beginning of an event, the end of an event and the recovery. The first time stamp occurs when speeds drop in the county while it is snowing. Conventional wisdom may dictate that a snow event starts as soon as snow begins to fall. However, this program was developed with the road user in mind. As such, the program does not consider an event to have started until it is snowing and the road speeds have dropped. The second time stamp occurs once precipitation has stopped and winds have died down. Wind is an important consideration, since snow can drift back onto the roadway even after it has stopped snowing. The final time stamp is when speeds are considered to have recovered. Speeds are recovered when the measured roadway speed is back to within 10 mph of the expected speed.
Ohio is split into 12 ODOT districts and 88 counties. Each county is responsible for maintaining its respective priority routes. The Snow and Ice Performance Evaluator models snow events on the county level. This means that the first two time stamps tracked by the program are the same for every route in the county. On average, a county has four priority routes with Inrix data available. Additionally, each county is assigned a minimum of three RWIS stations in or near the county to analyze weather. An event starts when 40% of the RWIS stations detect snow or ice while speed on 25% of the priority routes drops at least 10 mph below the expected speed. An event ends when less than 40% of the RWIS stations detect snow or ice, wind speeds fall below 15 mph and another event does not start within two hours. In the case that the program detects the beginning of another snow event within two hours after the end of a previous event, the two events are combined into a larger event.
The third time stamp is tracked separately for each route in the county. Each route within the county has a recovery goal of two hours after the end of the event.
The concept of “expected speed” may seem arbitrary; however a large amount of analysis goes into this figure. In addition to the measured speed across many segments, Inrix also provides the expected speed across these same segments. The expected speed is calculated from historical data and represents the speed motorists should be able to travel under normal conditions at that particular segment of the roadway, at that particular time of day. As such, the expected speed is not a static number and is not set at the speed limit. Therefore, when a route is deemed to have recovered in the program, it is a true representation of recovering the roadway back to normal conditions.
A simple, elegant method of reporting these results was necessary in order to push the program’s findings into application. As described above, various pieces of information are captured during each snow event: event start time, event end time, number of routes down, number of routes recovered and the time each route recovered. These results are grouped into a district monthly report. With a quick glance at the report, the user can identify when their particular county had events during the month and how many of the routes they were able to successfully recover within the goal. If there were any routes that did not recover within the goal, they are noted on the report. In addition to the standard PDF report, ODOT developed an interactive web-based representation of each snow event as a part of the program. The web-based report contains a map of each county priority route. The user can then utilize a slider to play the event backward and forward as a timeline. The maintenance priority routes are highlighted on the map if they are experiencing a speed drop at the time stamp specified on the slider. This tool provides the county-level managers with insight into exactly what happened in their county, minute by minute, during the snow event.
The program also generates monthly reports quantifying the resources it took to achieve the given results. The report catalogues anything from tons of salt used to hours of overtime worked. This provides an opportunity for decision makers to compare counties with similar results in terms of resource usage. If two similar counties attain similar results, with one of the two using much fewer resources to get to that point, there is an opportunity to share best practices across county lines.
In less than two hours
The 2013-14 winter was extreme in Ohio as in much of the rest of the region. Each district was hit with higher-than-average snowfalls and lower-than-average temperatures. ODOT maintenance crews faced unique challenges ranging from more frequent equipment failures to a shortage of salt. Even still, the performance measured by the Snow and Ice Performance Evaluator was high throughout the entire winter. Overall, the program detected 3,649 routes with speeds down during a snow event. ODOT was able to recover speeds on 3,443 of these routes before the two-hour goal. This means that speeds were regained over 94% of the time during one of the harshest winters in recent memory. However, certain counties and routes consistently performed below average according to the program. These areas are being further investigated to understand exactly what the data is highlighting and if any operational changes are necessary before the next winter season.
Managers have access to an unbiased review of their performance thanks to the ODOT Snow and Ice Performance Evaluator. The program models winter-weather events by analyzing speed and weather data. ODOT’s performance is rated based on the impact to the motoring public. ODOT finally has the ability to make informed decisions when allocating resources and making changes to standard operating procedures thanks to the reports output by the Snow and Ice Performance Evaluator. R&B
MacAdam is with ODOT Traffic Operations.


