Getting roughness information for a road is neither cheap nor fast.
Many cities and counties don’t have access to the high-end inertial profilers that produce roughness profiles expressed as the industry-standard International Roughness Index (IRI). Even at the state level, many highways are only evaluated every two or three years. The high-end inertial profilers require large capital investments and trained staff to operate them.
A new Android smartphone app aims to address these problems. The recently released RoadBump app utilizes an Android phone or tablet’s accelerometer and GPS sensors to estimate the roughness of a road. RoadBump was developed in consultation with the staff at the National Center for Asphalt Technology at Auburn University and the Civil Engineering Department at the University of Arkansas.
Methodology
RoadBump determines the roughness of a road using accelerometer data (gathered at ~100 Hz) as inputs to a differential equation which models the car’s suspension in real time. The model simulates the vertical movement of a wheel on a spring (vehicle suspension) with a resisting damper (shock absorber). The spring and damper model parameters vary with speed, which allows roads to be evaluated at normal (varying) driving speeds. A user-specified constant allows results from different vehicles with different device placements to be brought into the same range. Speed and location information for mapping come from the device’s GPS capabilities, which are recorded about once per second. RoadBump’s goals are to provide an extremely low-cost tool to gather roughness data, to pinpoint rough points on a road, and to provide relative comparisons of different roads or the same road over time.
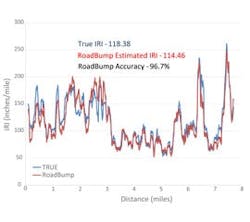
Accordingly, in the test case described below the IRI graphs RoadBump produced closely match the true IRI results from an ARAN van (the state of Arkansas’ inertial profiler). Averaged over a 19-mile road, RoadBump’s average IRI estimate was within 2% of true, and across five subsections of various lengths on that 19-mile road, no section’s IRI was off by more than 7.3%.
Test results
RoadBump was tested over a 19-mile section of road in central Arkansas—from the intersection of Highway 5 and Highway 64 to the intersection of Highway 5 and Baseline Road. The state highway department provided left- and right-wheel path IRI results from their ARAN van, which evaluated the same section of road a couple of months before the RoadBump test. The “True” column in Table 1 is the average of the left- and right-wheel path IRIs from the state’s ARAN van. The road was driven at the posted speed limit of 55 mph.
Over each of the five sections, RoadBump’s IRI averages were always within 7.3% of the true IRI.
Moving average IRI results for the state of Arkansas (True) and RoadBump’s data are shown in Figure 1 for section 4, a 7.7-mile section of the evaluated path. RoadBump’s moving average graph closely matches that produced by the state’s inertial profiler. Comparisons of the other sections show a similar tight fit.
The IRI data from the state of Arkansas was provided at 5-meter intervals. RoadBump generated 50,804 accelerometer records over that same stretch of road, yielding an IRI estimate every 9.6 in. Each series is a moving average covering 570 ft.
Looking at IRI averages for each 0.1 mile for section 7, RoadBump continued to show very good results. The results from section 7 (a 1.4-mile section) are shown in Figure 2 with IRI averages plotted for each 0.1 mile.
Factors that impact RoadBump’s ability to match up perfectly to road sections with known IRI are:
- Human error in driving the same exact path as the inertial profiler;
- GPS accuracy limiting accuracy of placing the start and end markers to a few yards;
- Distance not being measured as accurately as on the inertial profilers; and
- Modeling differences, as RoadBump-enabled vehicles “feel” each bump twice (front and back).
Operation
Upon launching the RoadBump app, it takes a few seconds to get a solid GPS fix and then it displays a giant Start button (first panel in Figure 3). Press the Start button and begin driving (you weren’t already driving and manipulating the phone were you?). When you press the Start button, it changes to a Stop button (second panel in Figure 3). When you have driven the section of road to be evaluated, stop the vehicle and press the Stop button. That’s all it takes to record the roughness of
a road.
From this point you can choose what to do with the new recording (third panel in Figure 3). From the Start screen you also have the options of managing, viewing and exporting existing recordings by using the folder icon on the top row of icons.
Figure 1. RoadBump IRI accuracy for Hwy. 5, Section 4
To get the most accurate IRI results, some configuration is needed, because the app doesn’t know what kind of vehicle it is in or where it is placed in the vehicle. This configuration is done by providing an adjustment factor in the settings from the Start screen. The adjustment factor can be fine-tuned by recording a section of road with a known IRI value. If you come in 20% high, reduce the adjustment factor by 20%. If you don’t have access to a stretch of road with a known IRI, you can follow the app’s suggestion of using 0.8 for trucks, 1.0 for SUVs and 1.2 for sedans.
The settings on the Start screen also allow you to configure the speed at which the app begins and stops recording data. Data at very low speeds is less accurate. The default is 20 mph.
When you view a recording, RoadBump displays a Google map of the path traveled along with graphs showing how the roughness varied across the recorded path. Old recordings can be compared one at a time to recent recordings to see relative changes in the roughness of the road. Figure 4 shows representations of a portion of the data displayed in the IRI comparison graphs of section 4.
Figure 2. RoadBump IRI accuracy on Highway 5, Section 7.
The first panel of Figure 4 shows a normal map view of the 7-mile test section from the graphs. The color-coded path driven is similar to what Google Maps’ traffic shows: Red indicates roughness over 120 in./mile, yellow is 90-120 in./mile and green is less than 90 in./mile. The cutoffs for the color limits are configurable from the Settings button on the map screen. The start and end markers can be dragged along the path to limit the data shown in the graphs.
The second panel shows a smaller section of the path, rotated, and a 0.1-mile segment level average graph. The segment length is configurable from the Settings button on the map screen.
The third panel shows the accelerometer data for a small portion of the path. In many cases you can see the change in the road that caused the spikes in the accelerometer graph. The blue line is the raw accelerometer data. The red line is a moving average of the previous 10 accelerometer readings. The green line is the absolute value of the difference between the raw accelerometer data and the moving average. RoadBump always displays the speed of the vehicle across the miles (or km) between the markers, regardless of which type of graph is shown above.
RoadBump’s data can be exported as comma separated value (CSV) files that can be used in other applications (e.g. Microsoft Excel). The raw accelerometer and GPS data can be exported, as can a segment level summary. The app also allows recordings up to two hours in length that can be later saved as smaller segments.
Figure 3. RoadBump App operations screens (3 panels).
Figure 4. IRI comparison graphs for Section 4 (3 panels).
Gathering insight
Comparing recordings of the same road over time, RoadBump can show the impact of maintenance work done (or not done). Reviewing a single recording can provide an insight as to whether a section of road is consistently rough or has a few spots that require attention.
The testing done with RoadBump shows that it can provide results close to the inertial profilers over extended distances. While the degree that RoadBump approximated the true IRI is impressive, many will find the most important thing RoadBump does is to provide in inexpensive means of achieving objective data, so that better, more cost-effective decisions can be made. R&B


