Pavement quality control is an important endeavor for transportation agencies.
It involves ongoing research for new methodologies in pavement surfacing. One of the main issues affecting the performance of asphalt pavement is segregation. Segregation is defined as “a lack of homogeneity in the hot-mix asphalt constituents of the in-place mat of such a magnitude that there is a reasonable expectation of accelerated pavement distress”.
Strength, durability and flexibility under different climates are expected from hot-mix asphalt (HMA). To reach high performance, HMA must have the same gradation as the lab design, and it must be mixed, transported and placed uniformly. The mixture is subject to potential segregation in each part of the manufacturing process—from stockpiling through mixing, storing and truck loading, and, finally, placement. Segregation can be considered in a mixture when there is a concentration of coarse materials in some parts of the pavement and a concentration of finer materials in other parts. Segregated pavement has a poor structural characteristic, poor durability and performance, a higher maintenance cost, and a shorter life expectancy.
Thermal segregation, another type of segregation, is known as temperature differential damage (TDD), and occurs when placing cool material over a prepared surface before compaction. This phenomenon happens due to the lack of uniformity in compaction temperature on the mat which reduces workability and consistency. In pavements, there are areas with differing temperatures called “cold areas.” These areas have a lower temperature than the surrounding mat. Cold areas are created by reducing the temperature of HMA during hauling and paving.
To qualify HMA segregation, three different methods can be used to detect segregation in the pavement: the visual identification method, density-based methods and texture measurement methods.
In the first method, an inspector determines the segregation based on visual information only. In most cases, application of this method leads to disagreement between the agency and the contractor. Also, in many cases, such as in the surface mix, it is hard to find segregated areas, because they appear only several months after the road is opened to traffic. The inability to detect segregation below the surface is the weakness of this method. The second method is based on density that can be categorized into the non-destructive or destructive test categories. This method defines the low level of density as an indicator of segregation in the pavement. The third method of detecting segregated areas is using pavement texture. There are several techniques such as using the Florida Texture Meter (FTM), the Circular Texture Meter (CTM) and 3-D digitizing that are used to measure pavement texture. It is possible to find segregation areas by measuring the texture.
Bringing images to life
With 3-D digitizing, pictures consist of divided elements named pixels. Each pixel has some information which shows color at that particular point. In other words, the color in each part of the image is represented by a pixel. Pixels are stored in bits which can be 0 or 1. The intensity of pixels in an image shows the quality of that image. The more pixels in the image, the higher quality and resolution it has.
Photos can be either colored or black and white. While colored images have a color level of pixels, black and white pictures have a gray level. The gray level can vary from 0 to 255, resulting in a 256-color spectrum. The basic colors to produce a color image are red, green and blue (RGB) which form the 16.7 million spectra. Extracting this numerical information from an image is called image digitization.
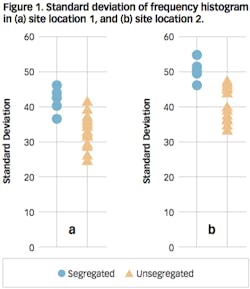
The frequency histogram is used to conduct digital image processing. The frequency histogram of an image is a graph which uses vertical columns to show the number of repetitions of each spectrum in an image. When the asphalt mixture frequency histogram is used, it is expected that the non-segregated area’s pictures have uniform colors. Most of the colors in non-segregated asphalt imagery are gray colors. In contrast, in a segregated pavement surface, the separation of bitumen and aggregates or fine and coarse aggregates may occur. This separation can cause darker or lighter color intensity in segregated areas of the image which can lead to a higher standard deviation of segregated pavement images in comparison with non-segregated pavement images.
In the following, this hypothesis will be investigated by using a Matlab program which defines the frequency histogram standard deviation. These results were then classified through linear discriminate analysis (LDA).
Testing the threshold
Two sites in Florida that were recently paved with an FC9.5 asphalt mixture were chosen for this study. A commonly paved asphalt mixture type in Florida, FC9.5 is a Superpave mixture with the nominal maximum aggregate size of 9.5 mm. In this research, newly paved pavements were selected to eliminate the effect of pavement aging and contamination on results. Experts from the Florida Department of Transportation (FDOT) designated the segregated and non-segregated areas on the pavement by the visual inspection method. Also, the pictures were evaluated by three other FDOT experts. The median of these experts’ inspection was considered for the spot locations where the inspectors’ ideas didn’t match. Fifteen non-segregated and five segregated points were selected at each test site. Since the type and resolution of the camera could effect the results, all the pictures were taken by the same camera and the same operator (same quality of pictures) from the same elevation.
Non-segregated areas have a lower standard deviation in comparison with segregated areas. This trend makes it possible to define a threshold between pictures indicating segregated and non-segregated areas. This difference between segregated and non-segregated frequency histogram standard deviation can be caused by the closer texture of non-segregated pavement in comparison with the segregated pavement. When segregation occurs, on one hand, coarse aggregates may separate from fine aggregates; therefore, aggregates in segregated locations may not have enough interlock, which can lead to an increase in voids between the aggregates, thus affecting pavement texture. This rise in voids in the pavement surface can cause brighter or darker colors, which can, in turn, result in higher standard deviation of segregated areas.
The threshold line that can separate segregated and non-segregated pavements was different at each site. Each group had a specific threshold line to separate segregated and non-segregated pavements, which was different from one another. Therefore, the threshold between segregated and non-segregated pavements was site-dependent. For each site, first the threshold line and membership prediction analysis was conducted, and the results were then used to determine segregated and non-segregated pavement areas. In this research, for these two projects, the overall accuracy to determine the pavement segregation in each site location was beyond 80% after conducting LDA.
Solving disputes
A new image processing-based method to detect segregation in asphalt pavements was introduced. In the proposed method, the frequency histogram standard deviation of the grayscale image was used to identify segregated asphalt mixture pavement areas. The LDA then performed to classify segregated and non-segregated image processing results. The visual inspection has been applied by FDOT experts to verify this new method’s result.
This new method, which is non-destructive, can provide an alternative solution to overcome disputes between contractors and agencies on the determination of segregated areas. Results from this work showed that images from segregated pavement areas have a higher standard deviation in comparison with those from non-segregated areas. This outcome is due to the void increase in segregated asphalt surfaces, which can lead to brighter colors in pavement images. It is indicated that in the non-segregated area’s image, the color distribution is uniform and the spectra includes gray level colors while the segregated area’s image has brighter or darker colors. To apply these results to the categorization of segregated areas, the threshold line between segregated and non-segregated pavements should be first identified through LDA. The results then can be used to define segregated areas.


