From 2005 and 2011, the number of U.S. traffic fatalities declined by over 25%, from 43,510 to 32,479.
Most of the drop occurred in 2008 and 2009, which coincided with what has been dubbed the Great Recession, running from December 2007 to June 2009.
Historically, recessions have been associated with sharp drops in traffic fatalities. But this latest recession also saw many other developments known to contribute to traffic safety, such as the improved crashworthiness of cars, advances in crash-avoidance technologies, educational campaigns to increase the use of safety belts, and continued installation of crash mitigation technologies such as rumble strips and various types of crash barriers. Was the sharp decline a synergistic convergence of trends that produced a new normal?
An interdisciplinary team assembled from the University of Michigan Transportation Research Institute (UMTRI) and the Texas A&M Transportation Institute (TTI) examined the factors behind the decline in traffic fatalities in the U.S., from 2008 to 2012. The team considered a broad range of factors, including changes in infrastructure, vehicle technologies, occupant protection, safety enforcement, and driver behaviors such as alcohol consumption, as well as economic factors such as fuel prices, unemployment rates and income levels.
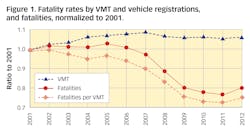
Conceptually, traffic fatalities are the product of risk times exposure. Exposure for traffic fatalities is related to the amount of travel, and risk is the likelihood that a fatality occurs per unit of travel. Figure 1 displays the relationship between exposure, measured by vehicle-miles traveled (VMT), where one vehicle traveling one mile equals one vehicle-mile traffic fatalities (outcomes), and traffic fatality rates by VMT (risk), over the period of study. The figure shows the ratio of the values for each year to the base year of 2001. Exposure as measured by VMT was relatively stable. However, the reduction in the risk of travel over the period pulled down the number of traffic fatalities. The decrease in exposure due to the recession and subsequent slowdown in economic activity contributed less. The goal of the project was to identify the sources of reduced risk.
Analysis approach
Factors that affected the incidence and risk of fatal crashes and fatal-crash injuries over the period were organized using the Haddon Matrix, which provides a framework that covers the factors considered comprehensively—vehicle, drivers, environment.
Fundamentally, two processes were at work over the period. The first process was the product of long-term trends in factors known to affect traffic safety, such as safety belt use, improvements in the crashworthiness of cars, highway infrastructure, traffic enforcement and safety campaigns, driver license laws, and other efforts to reduce the number of fatalities on U.S. roads. Most of these factors operate incrementally and change relatively slowly over time, but have produced a long-term downward trend in fatal crash rates.
The second process consisted of the factors that precipitated the sharp decline in fatal crashes and deaths in 2008–2011. The major event in this period was the recession that started in December 2007 and ended in June 2009. Compared with the components of the crash system—vehicles, drivers, environments—recessions have a short-term but substantial impact on drivers. Moreover, the recession affected some high-risk groups more than others, particularly younger drivers, thus taking some risky drivers off the road and reducing the amount of leisure and discretionary driving.
Findings and statistical models
Using the Haddon Matrix and the research team’s broad expertise, the team developed a comprehensive set of parameters to create statistical models of the incidence of traffic fatalities over the period. The data series covered a broad and comprehensive range of factors relevant to traffic safety, including the penetration of vehicle technologies, safety belt use, alcohol consumption, capital infrastructure expenditures related to safety, traffic enforcement, and fuel taxes, as well as measures of the state of the economy such as unemployment rates, median household income, and gross domestic product per capita. These data series were developed in each of the 50 states, from 2001 through 2012, and therefore, only parameters that could be found in each of the 50 states could be considered.
The team used two basic approaches to model the relationship of these factors to traffic fatalities. In the first approach, a set of count models (Table 1), using negative binomial regression models, captured the associations between predictors (safety-related and economic measures) and raw fatality counts. Two count models were developed. One used a state fixed effect to remove the stable differences between states and focus on changes over time (labeled the model considering state or MCS model). The other left out this fixed effect, allowing differences between states to be captured by the measured predictors (model not considering state [MNCS]).
The other statistical modeling technique was a log-change regression model (Table 2) to explore the association between the change in predictor variables in one year with the change in the outcome variable (traffic fatalities) in the following year.
The two modeling approaches were in broad agreement. Economic factors accounted for most of the drop in fatalities. The substantial increase in teen and young adult unemployment, the reductions in median household income, and the reduction in GDP per capita income accounted for around 85% of the reduction. The rightmost column in Table 2 estimates the percentage decline contributed by each factor in the change model. The relative decline in rural VMT (rural roads tend to have higher fatal crash rates for a given road class), increased strictness of DUI laws and decreased beer consumption also contributed. State highway spending was not a significant contributor to the decline over the period; the effect of changes in infrastructure was likely more cumulative and longer term. Changes in safety belt use rates and fuel prices were not significant contributors to the decline in traffic fatalities after 2007 because they did not change much over the period.
That certain well-established safety interventions (safety belt usage, highway capital improvements) were not found to contribute significantly to the sharp drop in traffic fatalities during the recession does not mean they are not essential tools to reduce traffic fatalities. It means that their impact was not detectable given the magnitude of the short-term effects of other factors. The long-term factors that set the baseline of traffic safety continued to operate. Overlaid on them was the short-term shock of the recession, which drove up unemployment, particularly among teens and young adults. Declining median income likely reduced driving, particularly risky driving, among high-risk populations.
Carrying it forward
In recent years, the number of traffic fatalities has increased significantly, rising by about 9% in 2015, and another 6% in 2016. The MCS model has been updated with more recent data in selected states to test whether the relationships held true for the subsequent period. The model did remarkably well.
Teens and young adults contributed disproportionately to the reduction in traffic fatalities from 2008 through 2011. Likely, loss of employment and income reduced total travel as well as risky (discretionary and leisure) travel. It has long been known that teens and young adults have disproportionately high crash risk, but the results from this study suggest that their behavior can be significantly modified over the short run, substantially reducing fatalities. The findings related to median household income suggest an income effect. This finding warrants further investigation to determine the association between risk and income levels, but interventions aimed at particular income groups may have a disproportionately positive effect, similar to reducing crash risk among teens and young adults.
The larger lesson here is that in any given year it may be difficult to discern the effects of safety countermeasures, due to the significant influence of external factors on traffic fatalities. The results here clearly illustrate that factors outside the authority of safety professionals can have major impacts on highway safety. In the short term, shocks in the economy can overwhelm the effect of safety interventions that generally influence crash risk in the long term. It is clear that exogenous factors such as economic trends should be accounted for in setting realistic goals and evaluating traffic safety programs, because the positive impact of proven safety countermeasures may be obscured by larger forces.


